Age at genetic diagnosis
The mean age at genetic diagnosis in this cohort was 6.8 (4.3) years [mean (SD); 95% CI = 6.6–6.9] with no difference between the sexes, t(2061) = -0.54, p = 0.589, d = 4.314. The average age at genetic diagnosis was substantially later for those with an SNV [9.0 (4.7) years] compared to those with a CNV [5.8 (3.9) years], t(2737) = 14.68, p < 0.001, d = 4.2. School records showed that participants with an SNV were nevertheless identified as having special educational needs at a similar age [5.5 (1.7) years] to those with a CNV [5.7 (1.7) years], t(2697) = −3.028, p = 0.003, d = 1.72. Participants with a familial variant were diagnosed with a genetic disorder at a significantly younger age [6.4 (4.1) years] than those with a de novo variant [7.1 (4.8) years], t(2737) = 3.041, p = 0.001, d = 4.574. Those with a familial variant were identified with SEN at a mean age of 5.9 (1.9) years, slightly later than those with de novo variants [5.5 (1.6) years], t(2697) = -4.699, p < 0.001, d = 1.714.
The mean age at genetic diagnosis of those with a familial CNV was 5.5 (4.1) years, a significantly younger age than those with a de novo CNV [6.3 (3.8) years], familial SNV [7.9 (5.5) years] and de novo SNV [9.3 (4.6) years], F(2096) = 86.55, p < 0.001. Those with a familial CNV were identified with SEN at a mean age of 5.5 (1.6) years, slightly earlier than those with de novo CNV [5.9 (1.9) years], t(1514) = -3.785, p < 0.001, d = 1.74; whereas pupils with a familial SNV were identified with SEN at a mean age of 5.9 (1.8) years, significantly older than those with de novo SNV [5.0 (1.4) years], t(271) = 3.132, p = 0.003, d = 1.49.
Genetic factors and daily life skills – Adaptive Behaviour Assessment System
The General Adaptive Composite (GAC) scores to assess the daily life skills were obtained from the Adaptive Behaviour Assessment System, version 3 (ABAS-3). The mean GAC standard scores of all the groups were in the ‘extremely low’ range, which encompasses just 2.2% of children from the general population27, [mean (SD)] [SNV: 60.2 (14), CNV: 64.8 (13); de novo CNV: 64.1 (14), familial CNV: 65.0 (13); see Table 1]. This implies participants in our study usually had very poor adaptive skills relative to the general population of children at a similar age. Proportionately more of those with an SNV had scores within the ‘extremely low’ range (SNV = 75.2% vs CNV = 66.4%), as did those with a de novo CNV (76.6%) [de novo (72.1%) vs familial (64.3%)].
Genetic factors and emotional behavioural difficulties – Strengths and Difficulties Questionnaire (SDQ)
Table 2 shows the comparisons of the total and subscales of the SDQ scores in different groups of variant types and inheritance. These have been categorised into bands indicating degrees of severity, based on data from UK population norms28,29 (see categorisation bands in Supplementary Note S1). For those with familial CNV (see Table 2), their total difficulties scores were on average in the ‘very high’ range; their emotional symptoms, conduct problems, hyperactivity and peer problems were in the ‘high’ band category. All SDQ subscale mean scores were significantly greater than the equivalent subscale scores in children with de novo CNV (all p-values < 0.001, Table 2), indicating that they had more severe difficulties.
Genetic factors and primary special education need (SEN) type
Supplementary Table S1 presents the total number and proportion of participants of different primary SEN types in each inherited/non-inherited variant type. A higher proportion of participants with SNV had profound multiple learning difficulties and severe learning difficulties. Table 3 shows primary SEN types for cohort participants who received EHCPs, broken down into inherited or de novo variant types. Nearly all participants with profound multiple learning difficulties or severe learning difficulties had received EHCPs (97–100%, see Table 3), regardless of their variant type or genetic inheritance. When observing the other primary SEN types, a relatively smaller proportion of pupils with familial CNVs had been granted EHCPs within each SEN category (familial CNV: 16.7–75.3%) compared with other groups (de novo SNV: 62.5–100%; familial SNV: 76.9–94.7%; de novo CNV: 44.4–91.4%).
EHCP obtainment and waiting time
By the time of ascertainment of this study, 2131 pupils (77.8%) had received an EHCP. The mean age at which participants were granted an EHCP was 7.1 (2.6) years (95% CI = 7.0–7.2), with no significant sex differences, t(2130) = -0.487, p = 0.626, d = 2.645. The average waiting time for an EHCP was 1.7 (2.2) years (95% CI = 1.6–1.8) with no sex difference, t(2130) = 0.128, p = 0.898, d = 0.003.
Genetic factors and EHCP obtainment
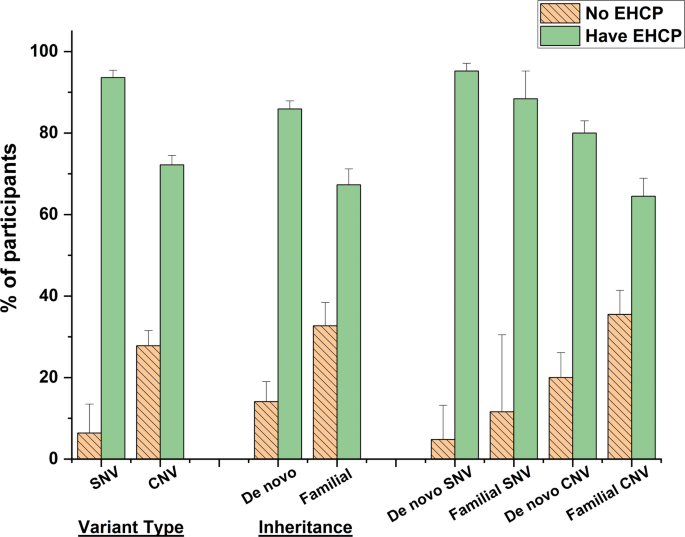
At the time of recruitment into our study, a higher proportion (93.6%) of participants diagnosed with SNV had been granted an EHCP compared to those with CNV (72.2%), χ2 = 140.565, p < 0.001, PHI = 0.227 (see Fig. 1). Overall, those with de novo variants (85.9%) were more likely to have been granted an EHCP compared to those with familial variants (67.2%), χ2 = 104.983, p < 0.001, PHI = 0.220. As shown in Table 1, the mean GAC scores for those with de novo or familial conditions were very similar, so this did not reflect substantial differences in the severity of their developmental delay. It is notable that those with a familial CNV were far less likely to have been granted an EHCP (64.5%) than those with a de novo SNV (95.2%), χ2 = 179.102, p < 0.001, PHI = 0.288. This is surprising as data in Tables 1 and 2 demonstrate that there were minor differences in the two groups in terms of GAC scores, and those with an inherited CNV tended to have more severe behaviour problems.

Comparisons of EHCP obtainment of the cohort participants with different variant types and genetic inheritance of the variants, with 95% confidence interval error bars. EHCP education health and care plan, SNV single nucleotide variant, CNV copy number variant, De novo non-inherited variant, Familial inherited variant.
Genetic factors and EHCP waiting times
The EHCP waiting time for participants with a de novo or familial CNV [2.0 (2.3) years] was twice as long as those with a SNV [1.0 (1.7) years], t(2130) = −10.978, p < 0.001, d = 2.14. In general, participants with familial CNV or SNV had to wait a significantly longer time to receive an EHCP than those with de novo variants [2.2 (2.5) years compared with 1.3 (1.8) years], t(1706) = −8.101, p < 0.001, d = 2.056.
Participants with a familial CNV who received an EHCP waited a mean of 2.4 (2.5) years from the age at which they were recognised as having SEN. Those with a de novo CNV waited a mean of 1.6 (2.0) years. Children with an inherited SNV waited a mean of 1.3 (2.0) years and those with a de novo SNV waited a mean of 0.9 (1.5) years. The EHCP waiting time were significantly different among these four groups F(3, 1703) = 45.917, p < 0.001.
Genetic inheritance, socioeconomic status (SES) and EHCP obtainment
We examined whether genetic inheritance was associated with family socioeconomic status. Pupils with familial variants were more likely to live in lower index of multiple deprivation (IMD) deciles, i.e. more deprived areas (X2(9) = 125.423, p < 0.001, see Supplementary Table S2), and proportionately more of them were eligible for Free School Meals (FSM) (X2(9) = 334.827, p < 0.001). Overall, twice as many children (49%) with familial variants were eligible for FSM compared to those with de novo variants (25%), X2 = 126.602, p < 0.001, PHI = 0.242 (see Supplementary Table S2). The proportion of those with de novo variants was very similar to the national figure (25.7% pupils with FSM eligibility in England in 2025)30.
Participants with de novo CNV living in more socioeconomically deprived IMD quintiles were less likely to have been granted an EHCP than those with a de novo SNV, X2(4) = 23.69, p = 0.017 (66.2–88.2%, see Fig. 2 and Supplementary Table S3). Those with familial CNV had the lowest proportions of participants (61.1%-68.9%) to have been granted an EHCP than those with the other variants no matter in which areas they lived. Overall, a higher proportion of participants with de novo or familial SNV (83%-97.5%) had been granted an EHCP whatever IMD quintile they resided (see details in Supplementary Table S3).

Distribution of the participants with different variant types who were granted with EHCP in the index of multiple deprivation (IMD) quintile areas, with 95% confidence interval error bars. IMD quintiles 1–2 = more deprived areas; IMD quintiles 9–10 = least deprived areas. EHCP = education health and care plan; SNV single nucleotide variant, CNV copy number variant, De novo non-inherited variant, Familial inherited variant.
General linear model analysis showed that participants with familial CNV waited significantly longer for an EHCP than those with de novo CNV at the IMD quintiles, F(1, 1121) = 50.742, p = 0.002 (see Fig. 3 top panel), whereas no significant differences between participants with familial SNV and de novo SNV was found, F(1, 584) = 2.559, p = 0.174 (see Fig. 3 bottom panel).

Comparisons of the EHCP waiting time for participants with different genetic inheritance (De novo/Familial) of variant types (CNV/SNV). Means and 95% confidence error bars are presented. EHCP education health and care plan, SNV single nucleotide variant, CNV copy number variant, De novo non-inherited variant, Familial inherited variant.
Parental education level and EHCP obtainment
We investigated whether the education level of the birth fathers or mothers affected the outcome of the EHCP obtainment and waiting time. Pupils whose birth fathers had received higher education (post-school college or university attendance) were more likely to have been granted an EHCP, X2(5) = 18.249, p = 0.006, N = 1242 (see Fig. 4), than those whose fathers had lower educational achievements. No equivalent differences were found for birth mothers, X2(5) = 8.713, p = 0.19, N = 1242. Waiting times for the provision of an EHCP were shorter for the children whose parents had received higher education (1.3–1.5 years), F(5, 885) = 7.007, p < 0.001 for birth father; F(5, 988) = 6.317, p < 0.001 for birth mother (see Fig. 5).

Distribution of the cohort proportion with EHCP against different parental education levels, with 95% confidence interval error bars. EHCP education heath care plan, GCSE General Certificate of Secondary Education Qualification, O-level Ordinary Level Qualification, A-level Advanced Level Qualifications.

Figure 5 displays the EHCP waiting time of participants against their parental education levels. Mean and 95% confidence interval error bars are presented. EHCP education heath care plan, GCSE General Certificate of Secondary Education Qualification, O-level Ordinary Level Qualification, A-level Advanced Level Qualifications.
The proportion of parents who had achieved a university education or higher degree was substantially lower if the child’s genetic anomaly was inherited (from birth fathers: X2(5) = 87.683, p < 0.001, N = 1024; from birth mothers: X2(5) = 69.366, p < 0.001, N = 1112, see Supplementary Figure S1). Parental education level did not significantly influence the proportion of participants with either de novo or familial variants whose child was granted an EHCP. Nevertheless, participants with de novo variants and whose parents had experienced higher education obtained an EHCP more quickly (for birth fathers: F = 3.61, p = 0.003; for birth mothers: F = 5.744, p < 0.001, see Supplementary Figure S2). In contrast, overall the EHCP waiting time for children with inherited variants was not influenced by their parents’ education level (p-values > 0.213), but in general they waited longer than those with de novo variants.
Regression analysis and the predictors
A hierarchical logistic regression analysis showed that variant type, genetic inheritance and socioeconomic deprivation (IMD decile) were significant predictors of EHCP obtainment. These associations remained significant in fully adjusted models that accounted for the child’s developmental level, parental education and child characteristics (see Model 9 in Table 4). In the fully adjusted model, the odds of a child with an SNV obtaining an EHCP were almost four times higher than the odds of a child with a CNV being granted an EHCP (OR = 3.831, 95% CI = 2.12–6.94, p < 0.001). The odds of those with a de novo variant obtaining an EHCP were nearly two times higher than those with a familial variant (OR = 1.695, 95% CI = 1.08–2.66, p = 0.022). The cohort children from less deprived areas (higher IMD decile) were significantly more likely to obtain an EHCP. Each step up the deprivation scale corresponds to roughly a 14% increase in the odds of receiving one (OR = 1.145, 95% CI = 1.06–1.23, p < 0.001). Children with higher GAC standard and SDQ total difficulty scores were significantly less likely to receive an EHCP. Each extra point on each score is linked to about 8 and 5% reduction respectively in the odds of obtaining an EHCP.
The hierarchical linear regression models showed there was also a significant association between genetic factors (variant type and inheritance), socioeconomic deprivation and EHCP waiting time. These associations remained significant in fully adjusted models. Children with a SNV obtained EHCPs sooner than those with a CNV [B(SE) = −0.109 (0.03), p < 0.001, see Model 9 in Table 4]. Children with de novo variants had slightly shorter EHCP waiting times than those with familial variants [B(SE = -0.082 (0.03), p < 0.022]. Participants living in less deprived areas tended to have shorter EHCP waiting times [B(SE) = −0.016 (0.004), p < 0.001]. Higher GAC standard score and SDQ total difficulty scores were associated with shorter EHCP waiting times, however, the per-point effects were very small [B(SE) = −0.011 (0.001), p < 0.001 and B(SE) = −0.005 (0.002), p = 0.013 respectively].