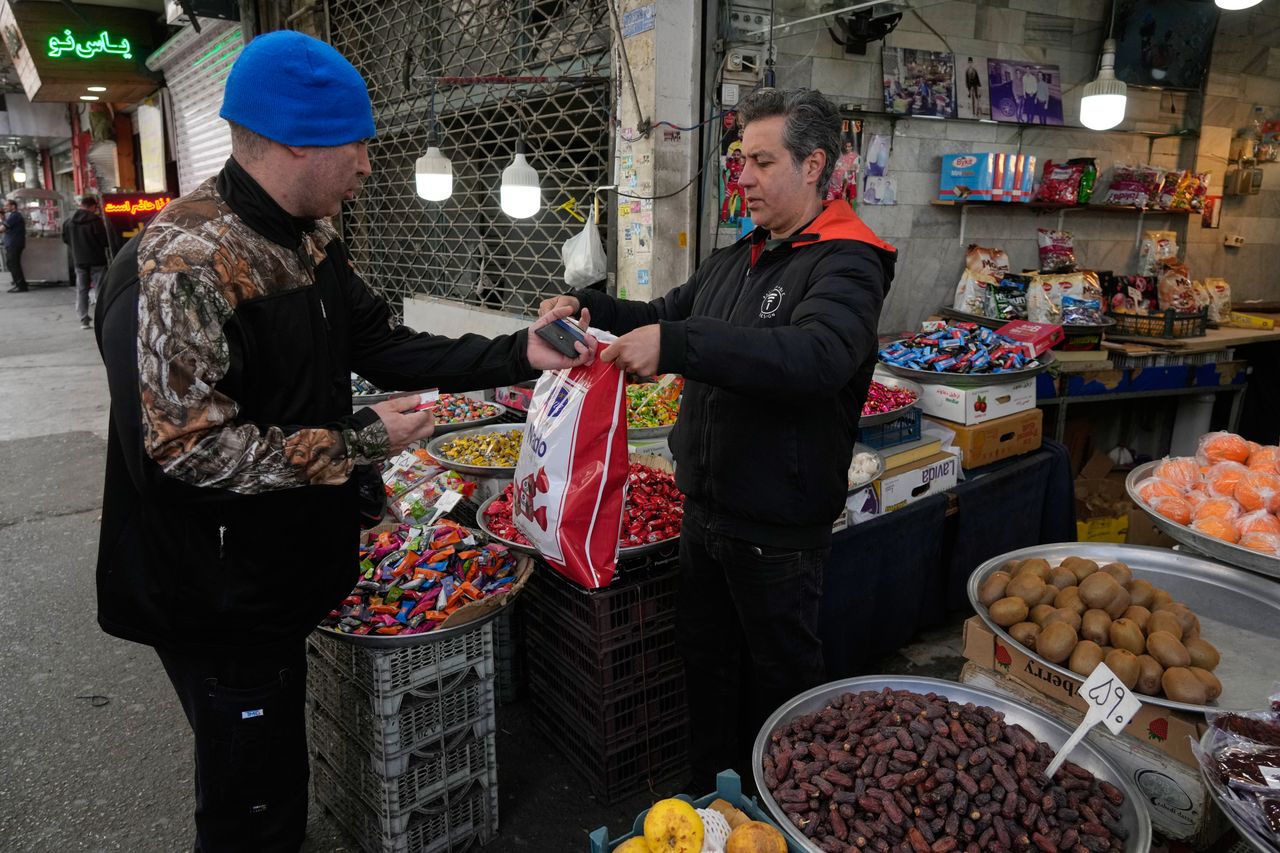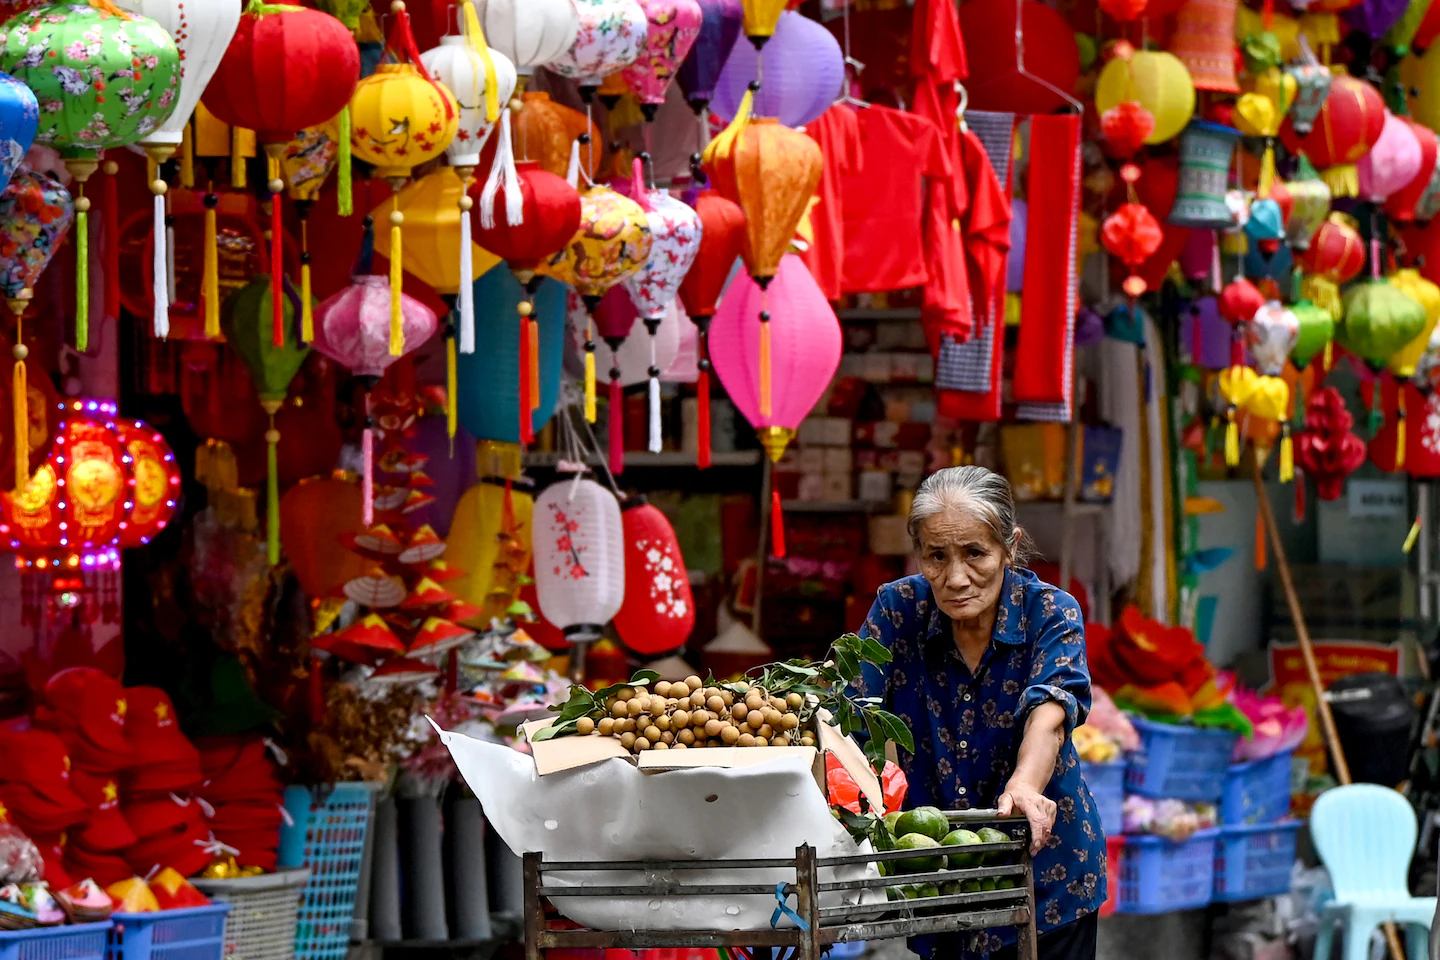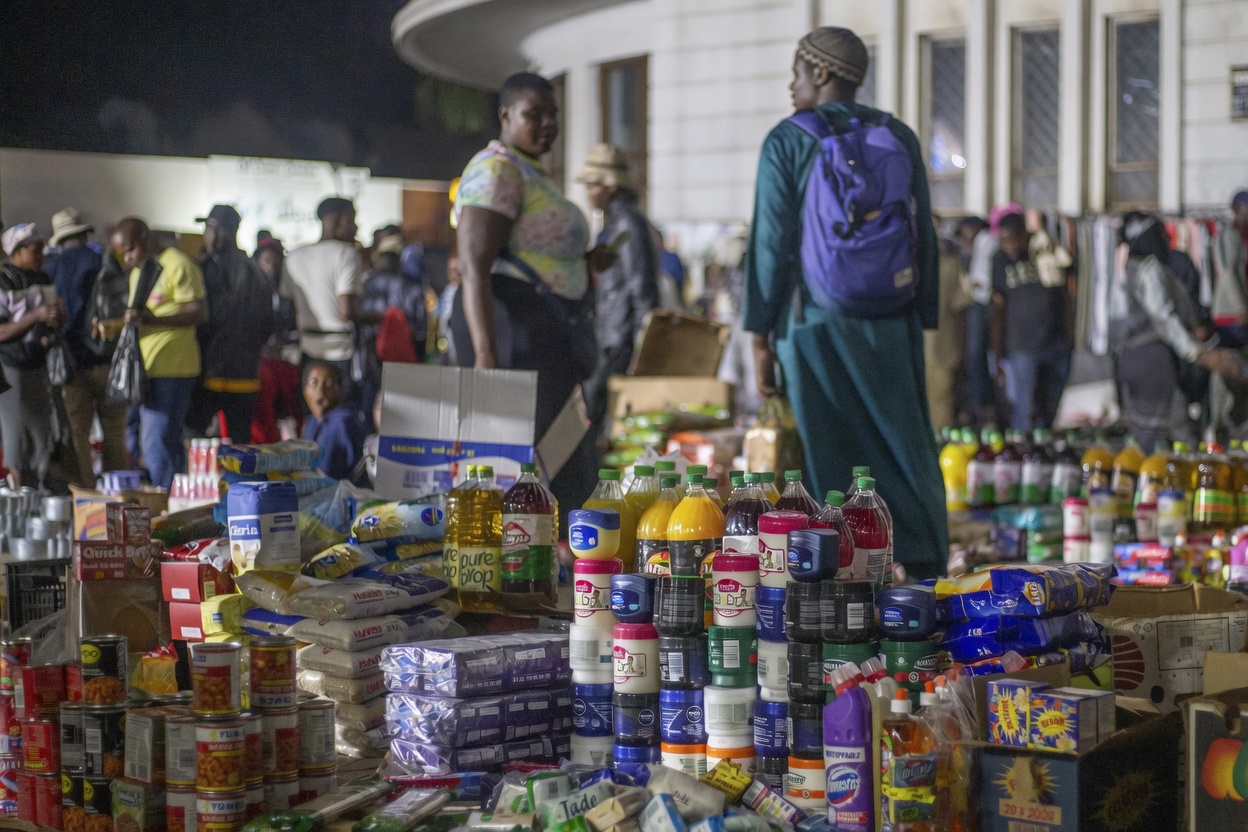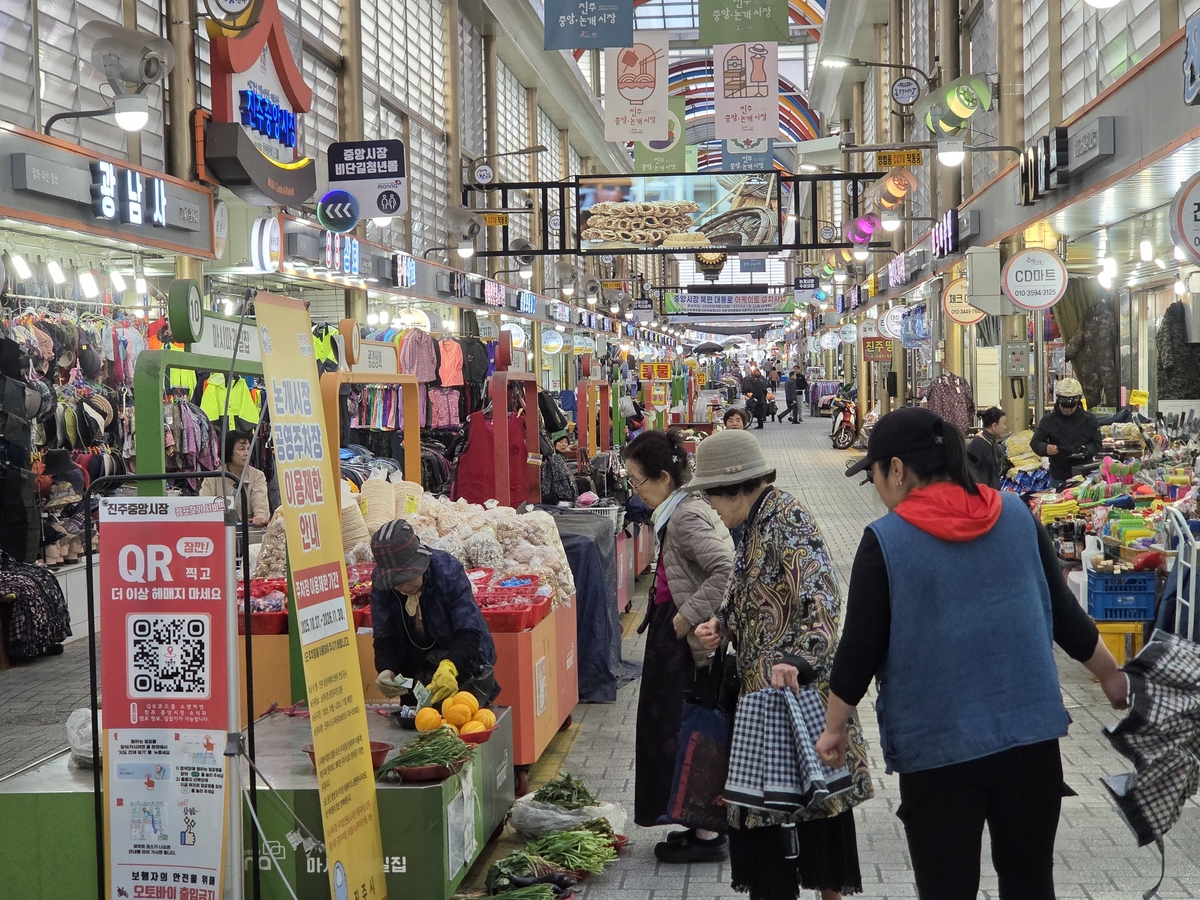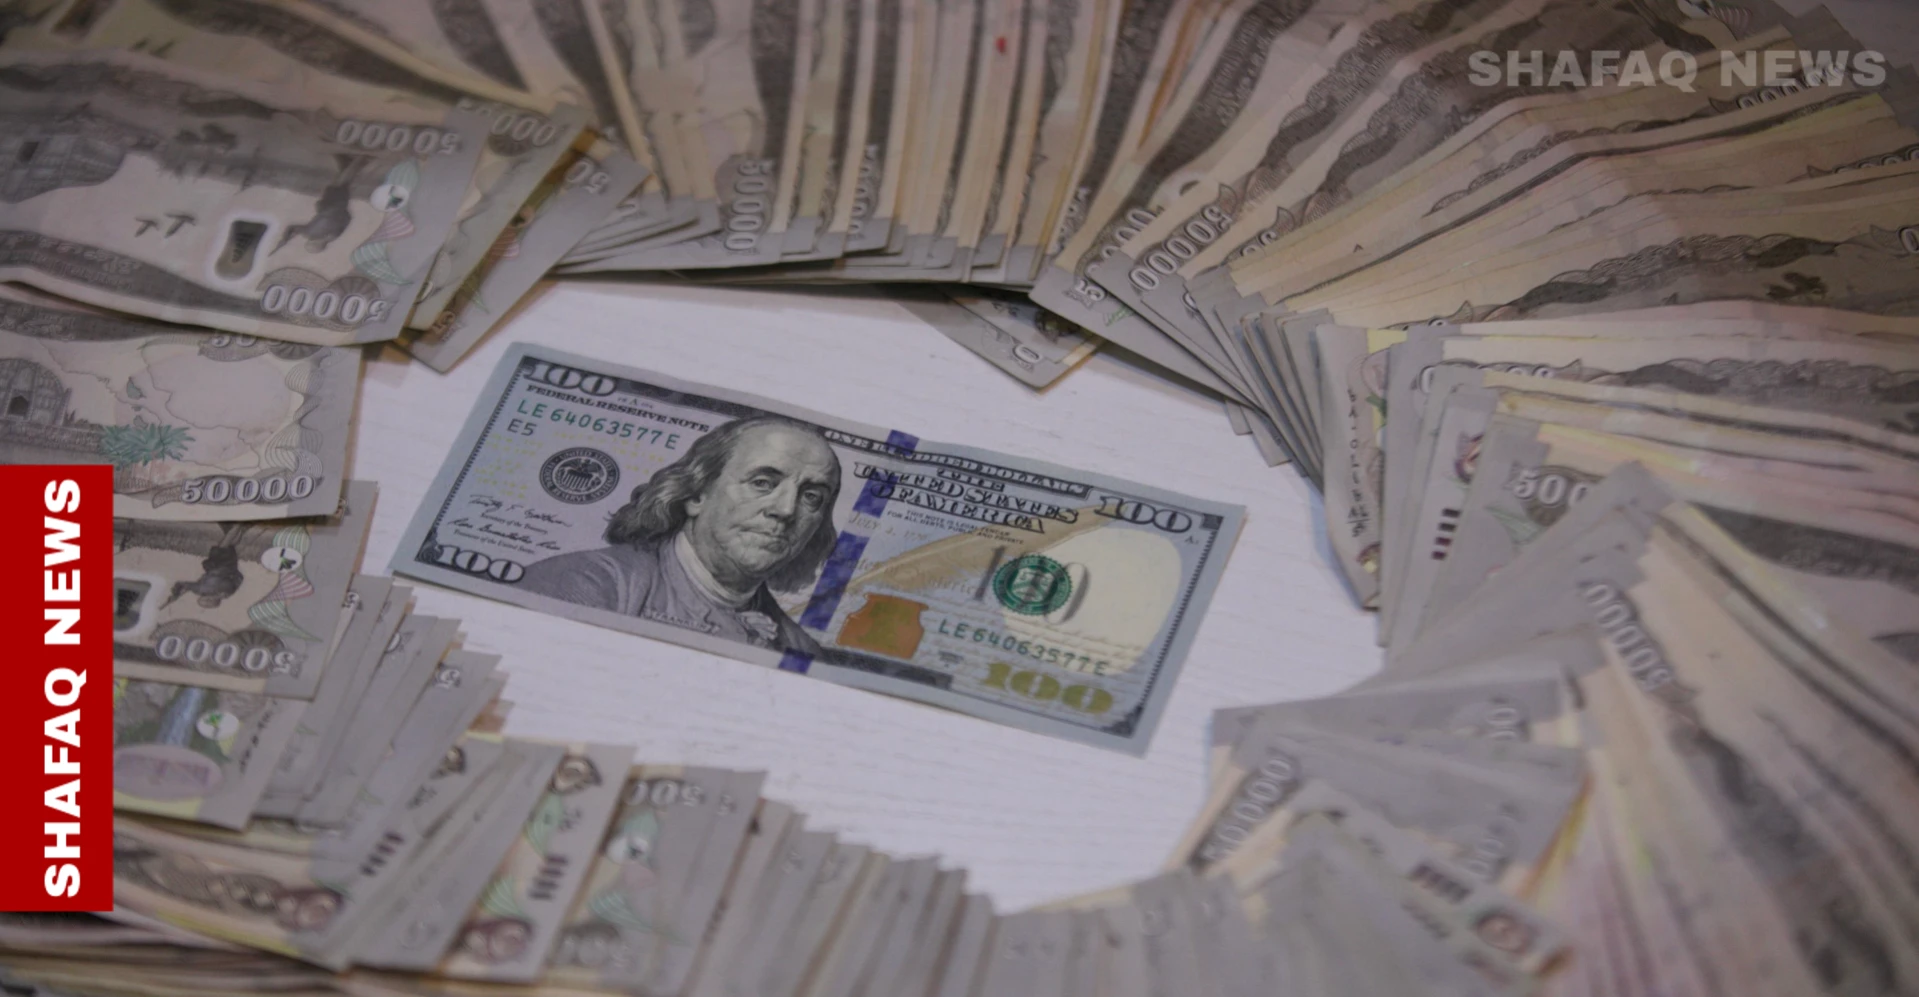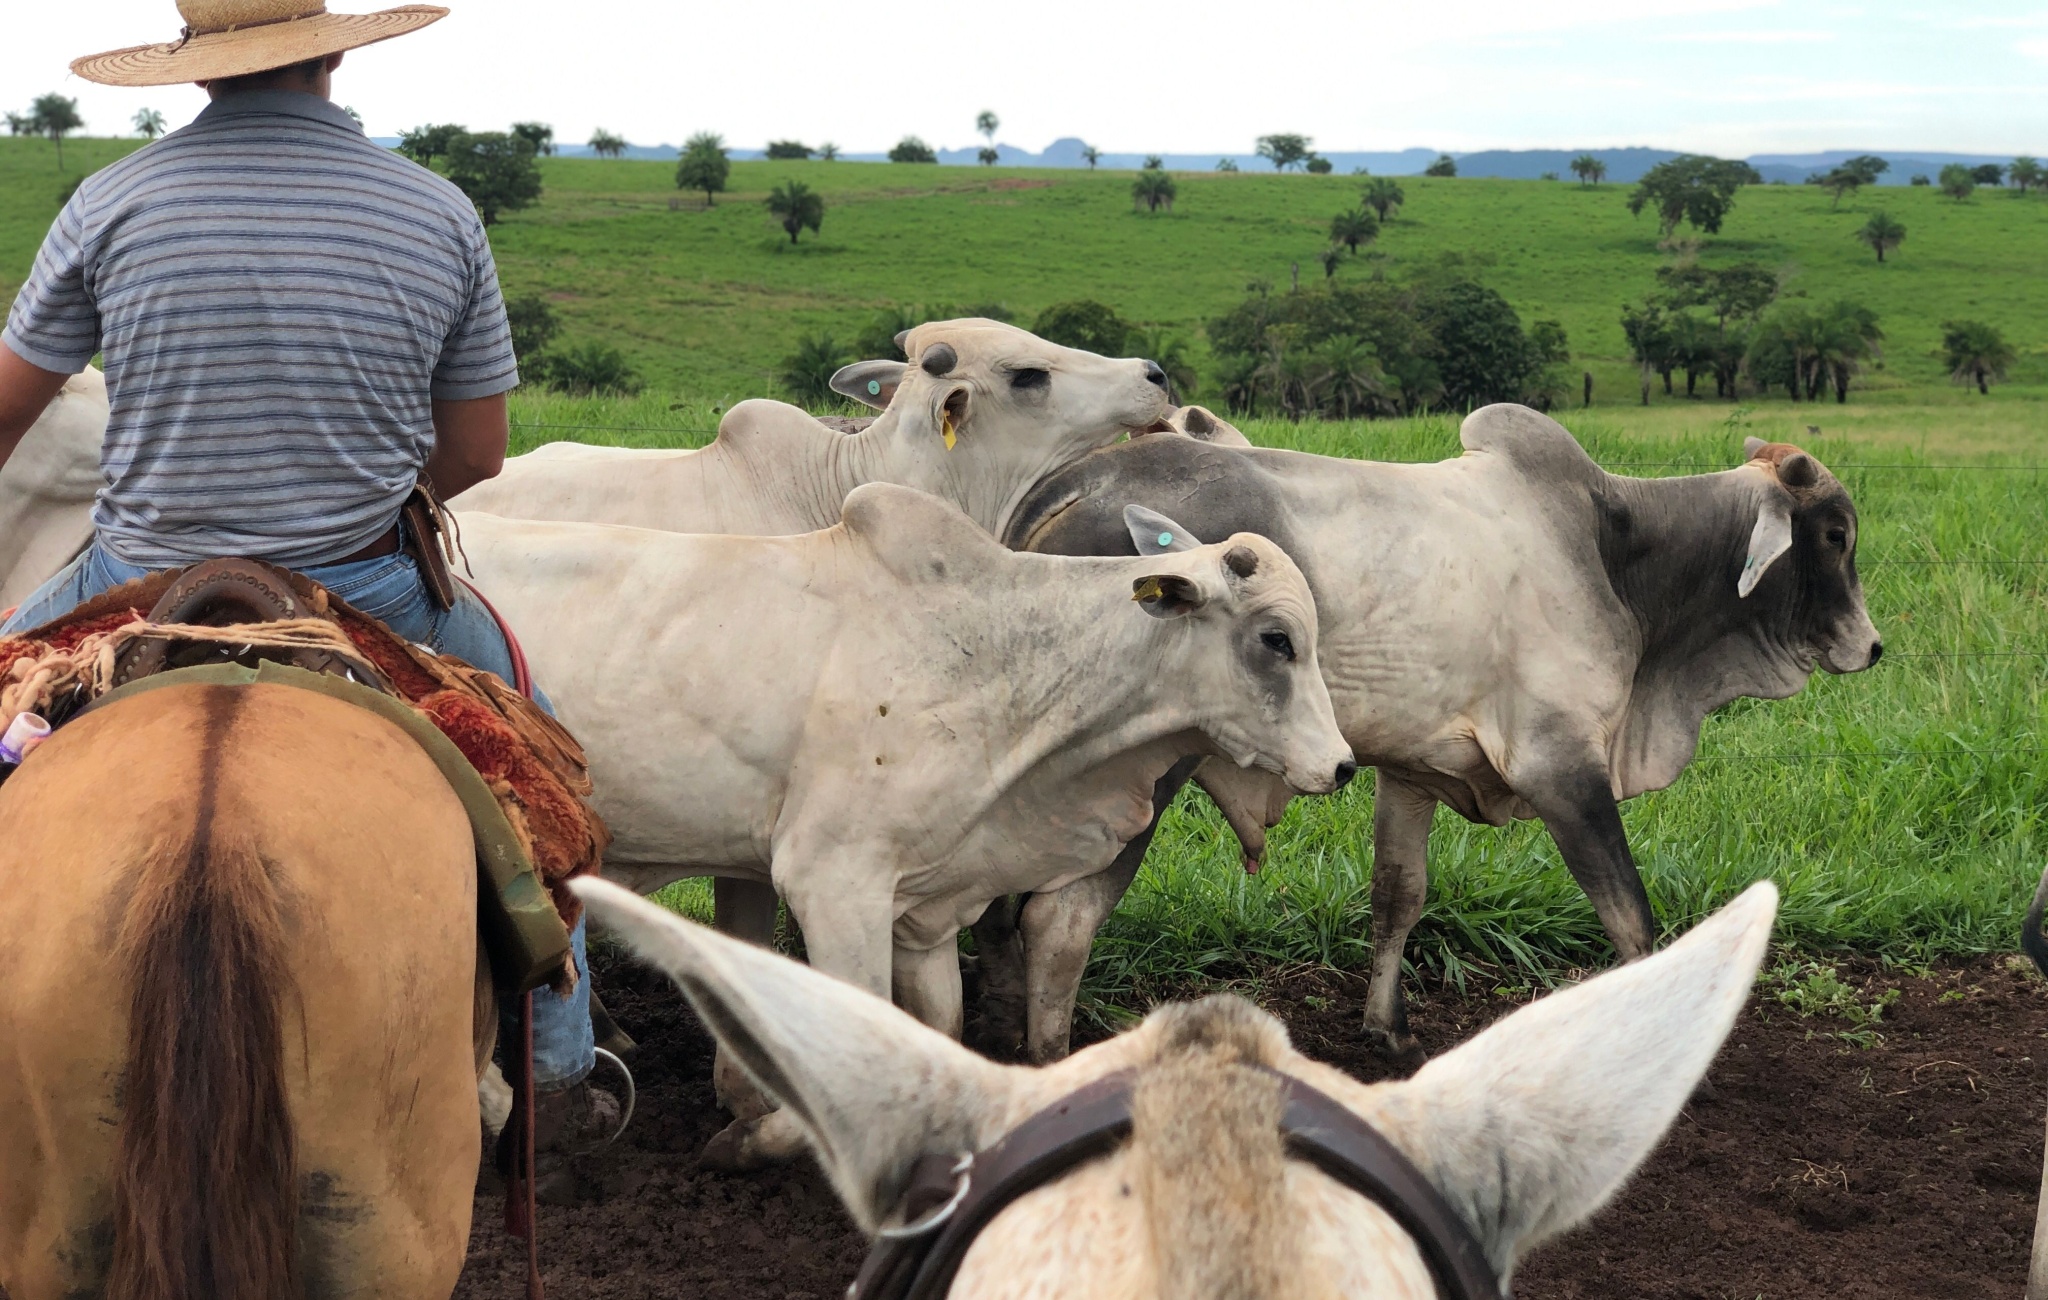
Every Eid-ul-Azha, Bangladesh conducts one of the largest concentrated acts of animal sacrifice in the world. In 2024, around 1.04 crore animals were sacrificed in roughly 72 hours, including 47.7 lakh cows, 1.13 lakh buffaloes, 50.6 lakh goats, and 4.7 lakh sheep, according to official livestock data. In 2025, the number fell to 91.36 lakh animals. The headline figure, often described as a Tk 100,000 crore seasonal economy, is widely reported. Far less examined is the uncomfortable truth beneath it: the qurbani (which means sacrifice) economy leaks value at almost every node, and because the leakage is seasonal, scattered and familiar, no one is held accountable.
Three arguments need attention here. First, qurbani and hajj are a single seasonal foreign exchange event, but we manage them as if they were unrelated. Second, the rawhide value chain—the part of qurbani with the greatest downstream potential—is the least well-governed segment of the entire cycle. Third, the remedy is not moral appeal, but institution-building.
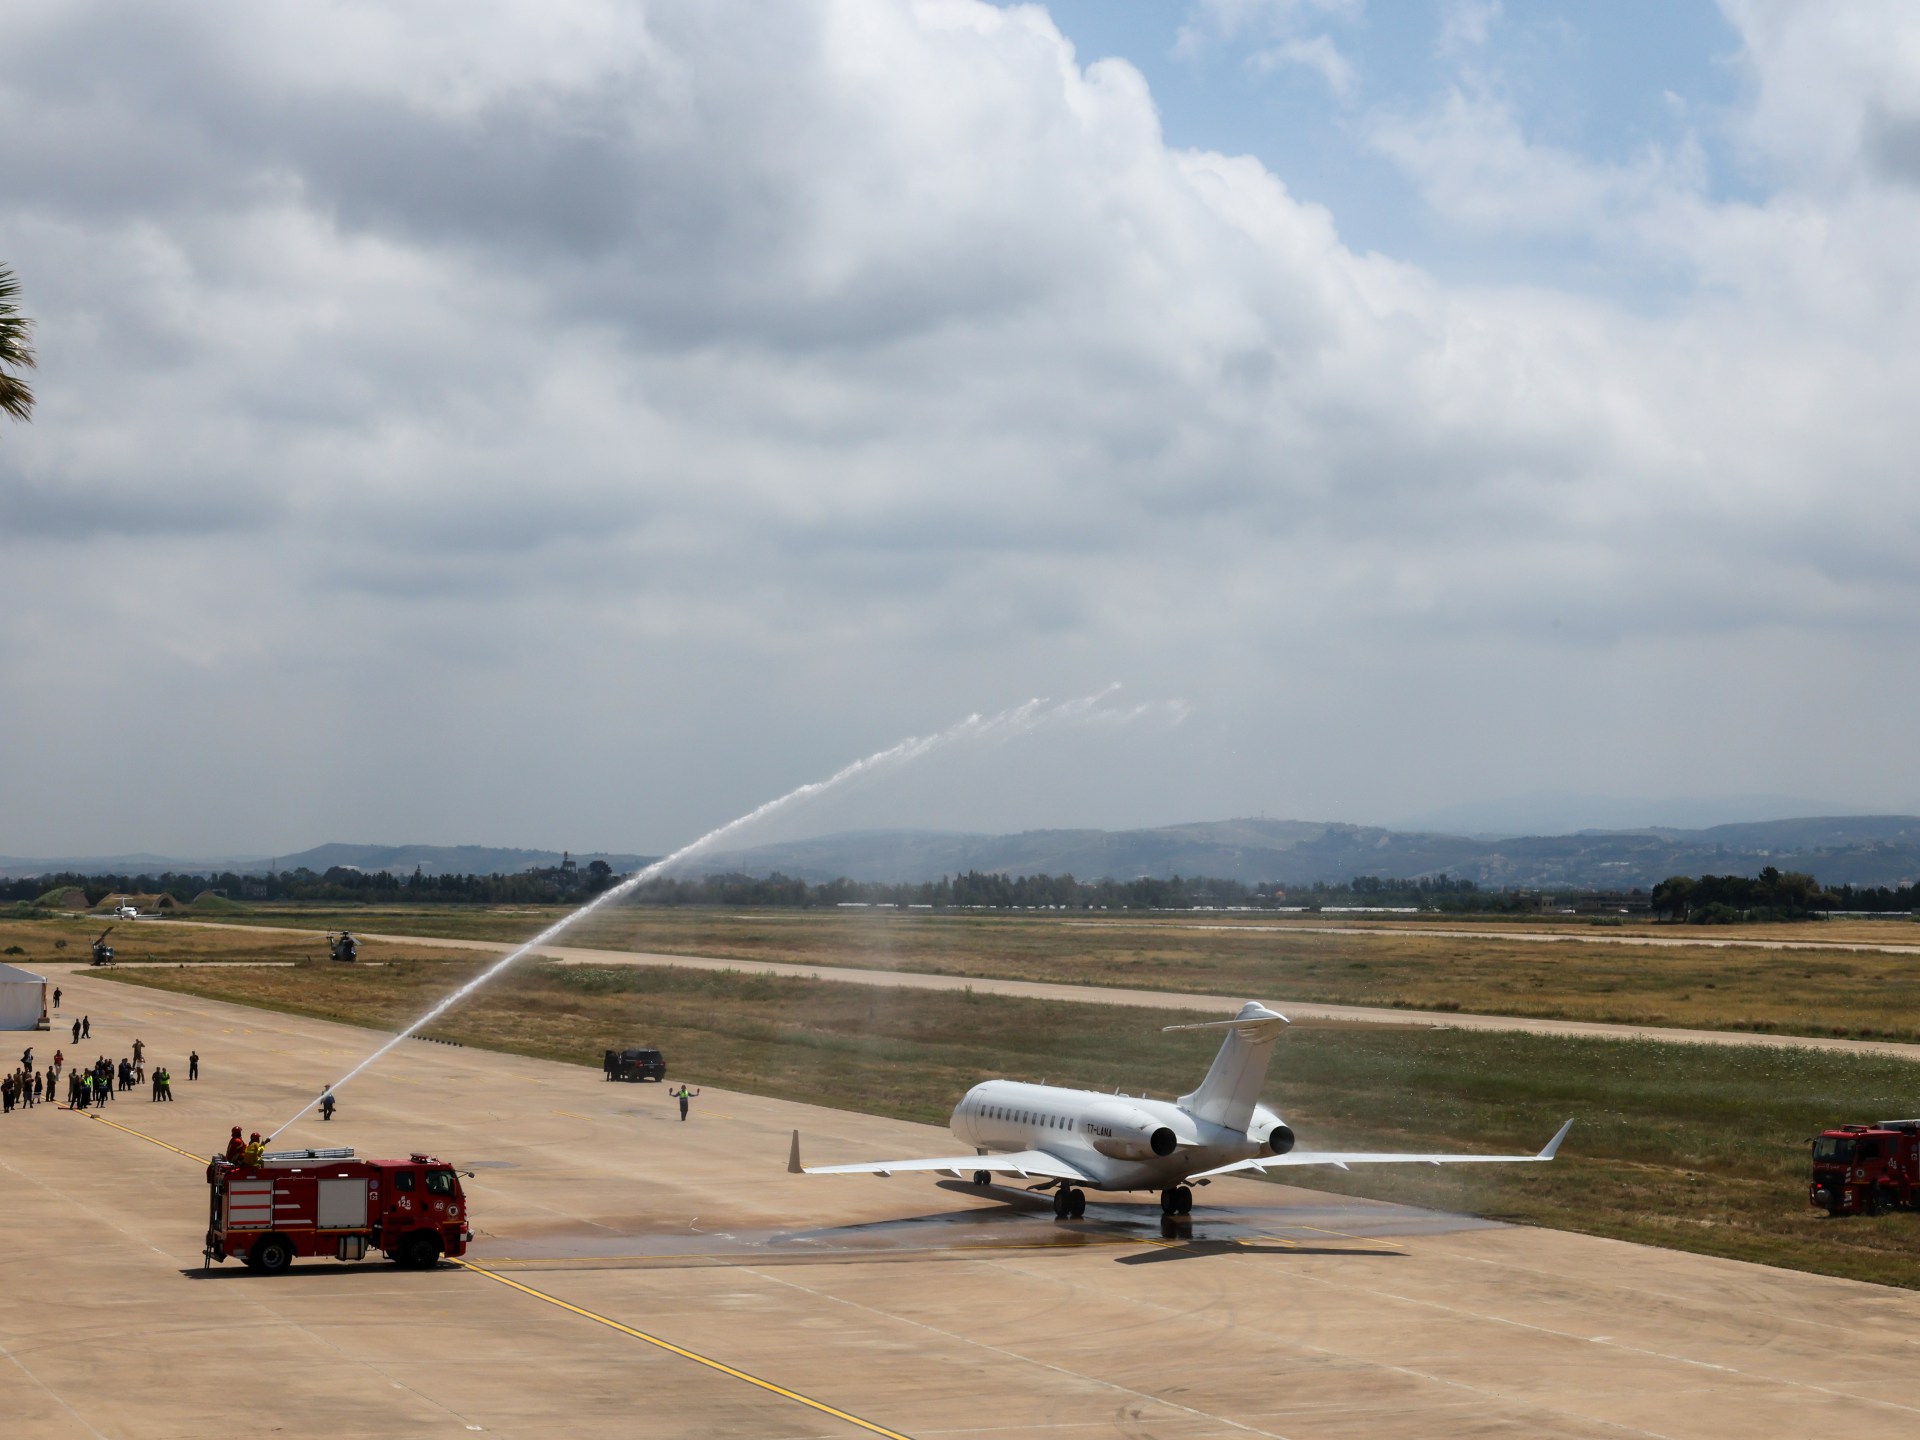
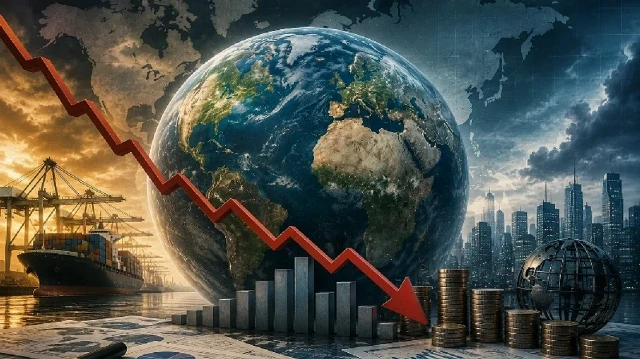
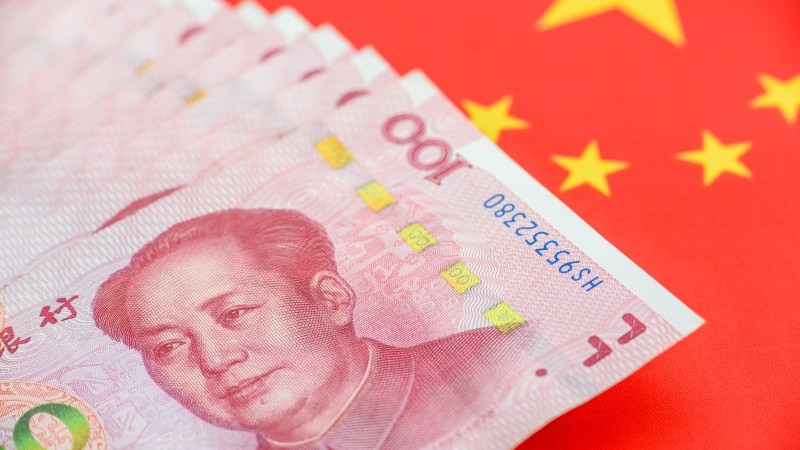
Qurbani does not occur in isolation; it falls in the same window as hajj, and together they create a sharply concentrated demand for foreign exchange. Last year, each Bangladeshi pilgrim was required to carry Saudi riyals equivalent to Tk 40,000 for food and an additional 750 riyals for the Makkah-side sacrifice. With about 87,000 Bangladeshis performing hajj in 2025, the Makkah qurbani coupon alone moved roughly $17 million out of the country. Add the dollar-denominated cost of imported feed additives, breeding stock, vaccines, and veterinary inputs that support the domestic qurbani herd, and the festival becomes a meaningful claim on forex reserves.
This matters, especially because the timing is unforgiving, given that the Bangladesh Bank is rationing dollars for fuel, fertiliser, food, and industrial inputs. Yet, hajj remittance facilitation is treated as a religious affairs matter, while the qurbani livestock trade is treated as an agricultural matter. In macroeconomic terms, however, they are part of the same seasonal currency event. No agency owns the combined exposure. That is not a bookkeeping inconvenience but an institutional gap.
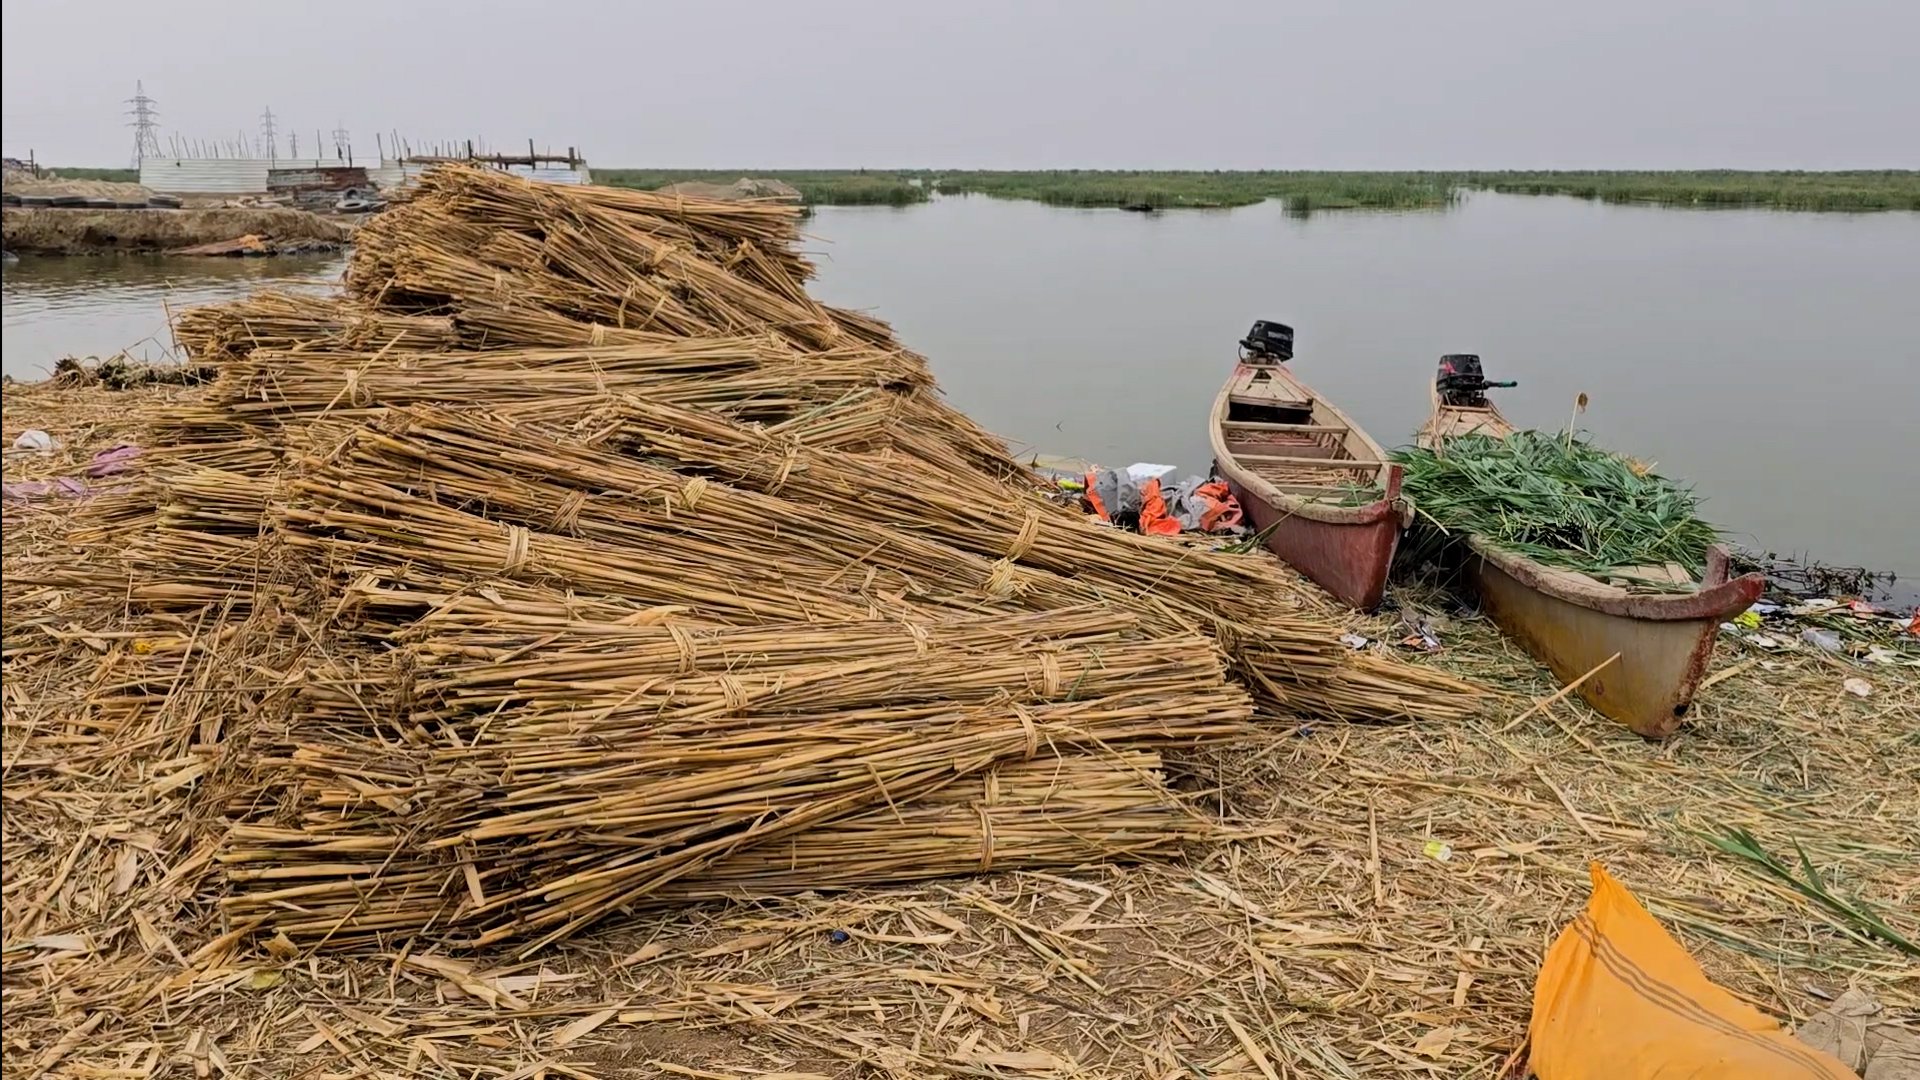
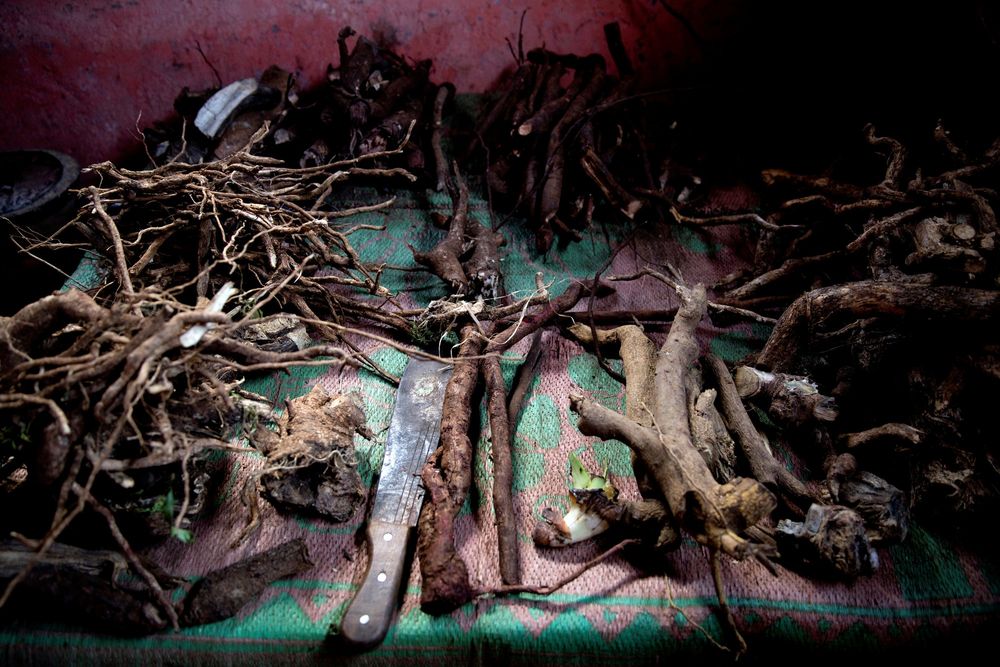
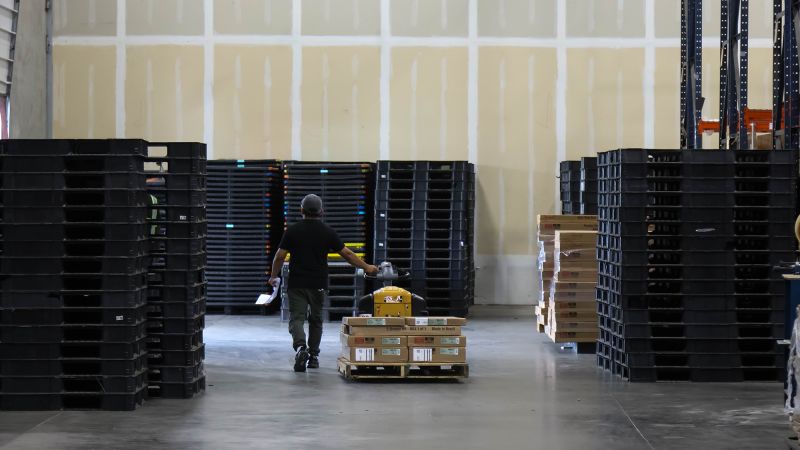
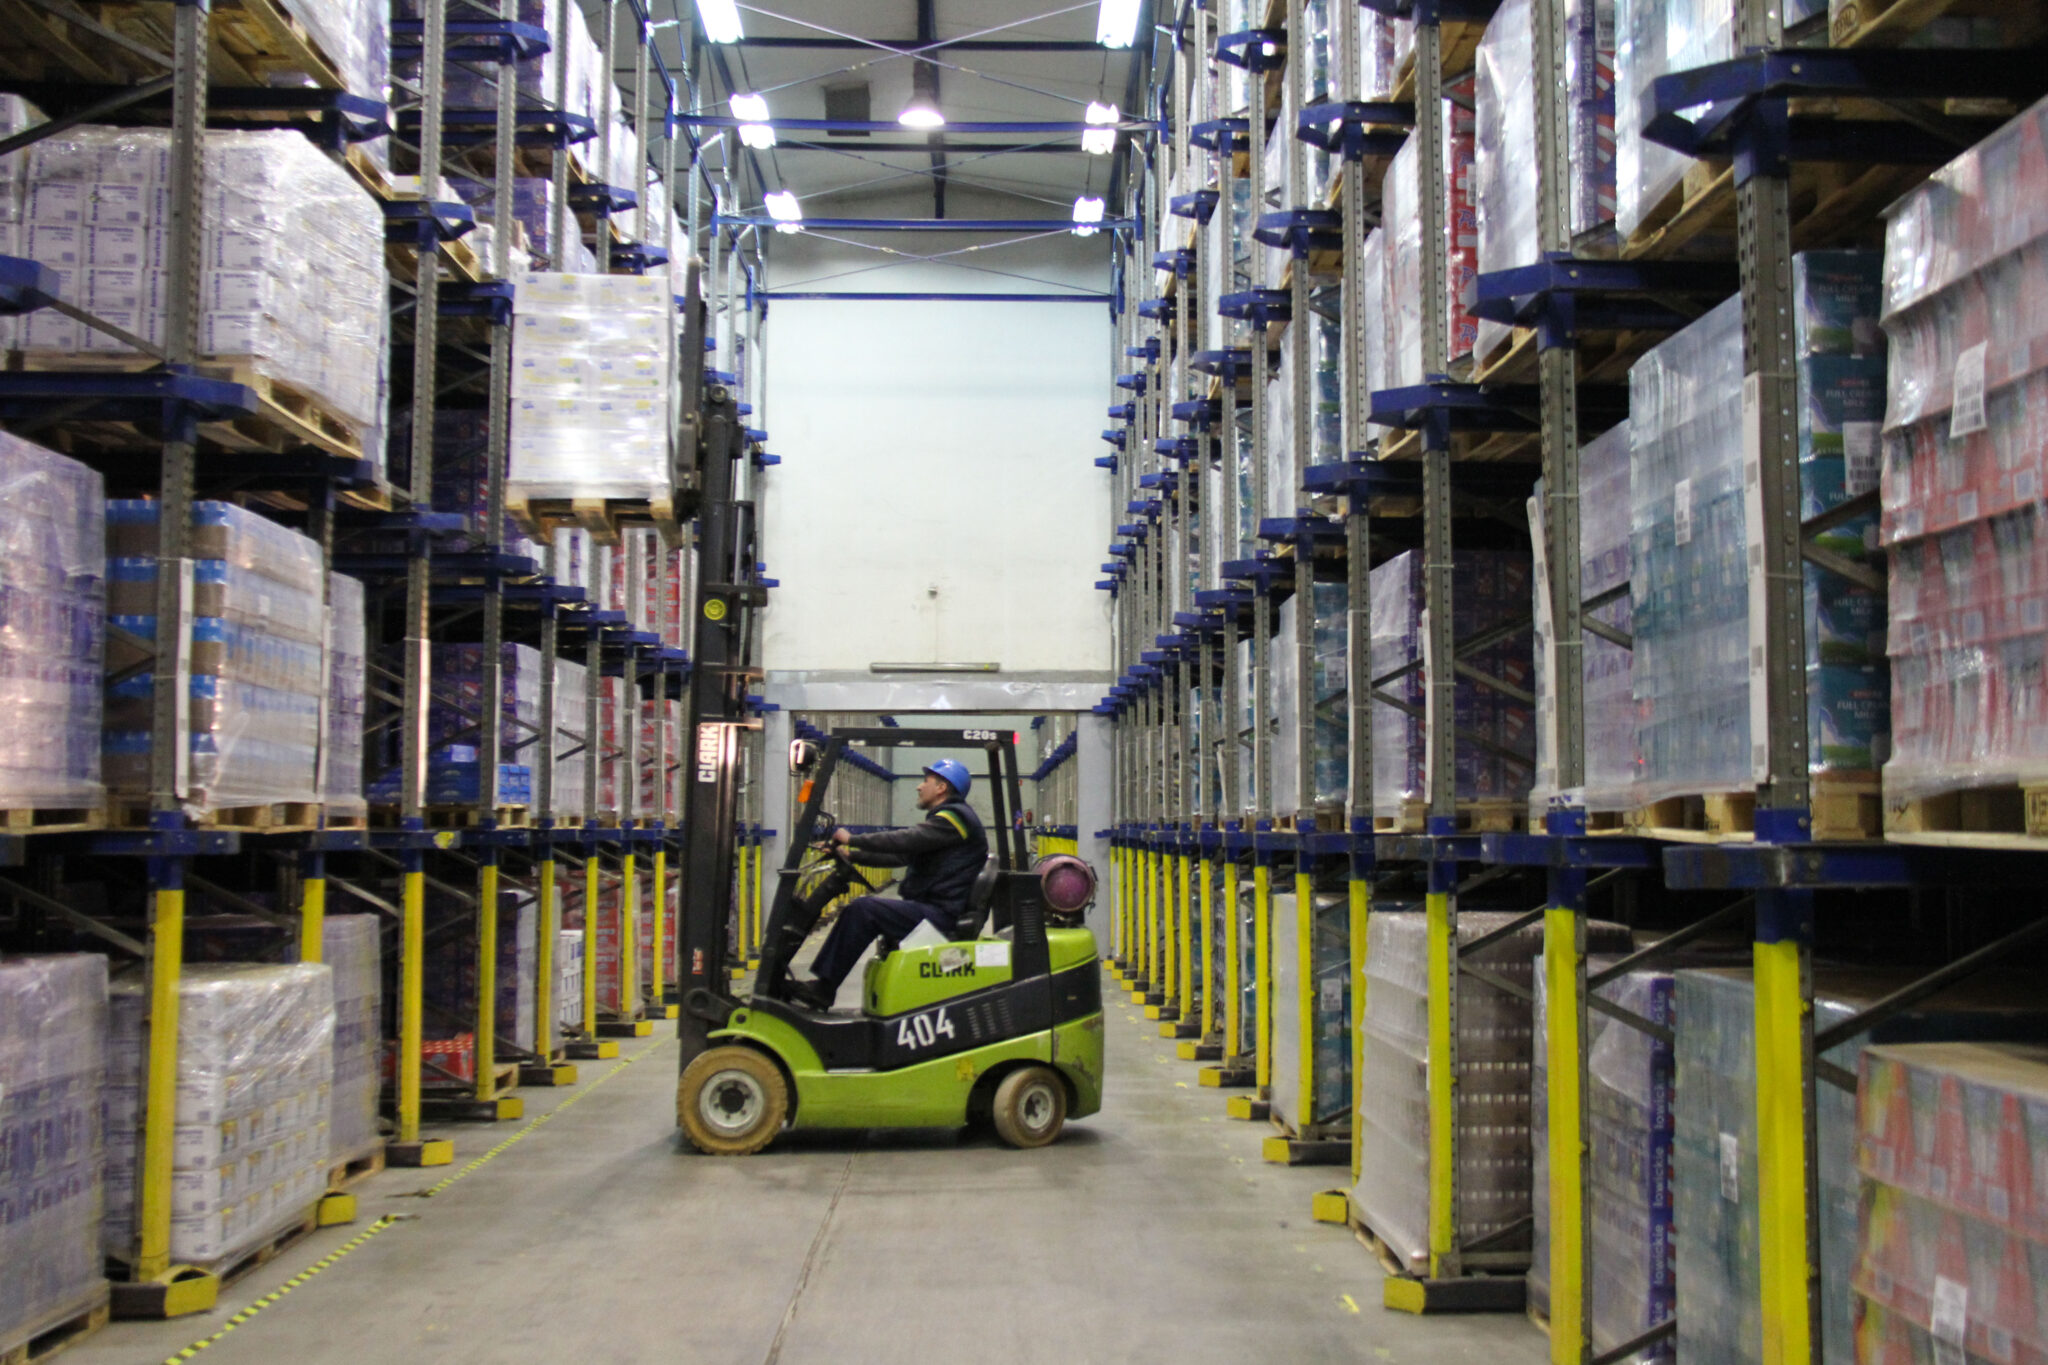
The most glaring leakage is in rawhide. Roughly half of the country’s annual rawhide supply is collected during Eid-ul-Azha. Those hides feed a leather and leather goods export industry worth more than $1 billion annually. On paper, Eid-ul-Azha is the most important raw material event for one of Bangladesh’s major export sectors. In practice, however, the pipeline is broken.
The Central Effluent Treatment Plant (CETP) at the Savar Tannery Industrial Estate in Hemayetpur—the facility that justified moving tanneries out of Hazaribagh—has not delivered the compliance architecture the sector needs. Without a fully functional CETP and solid waste system, the estate cannot secure Leather Working Group certification, the standard that many premium buyers require. The absence of LWG certification keeps Bangladeshi leather away from higher-value Western supply chains and pushes tanners towards lower-priced buyers.
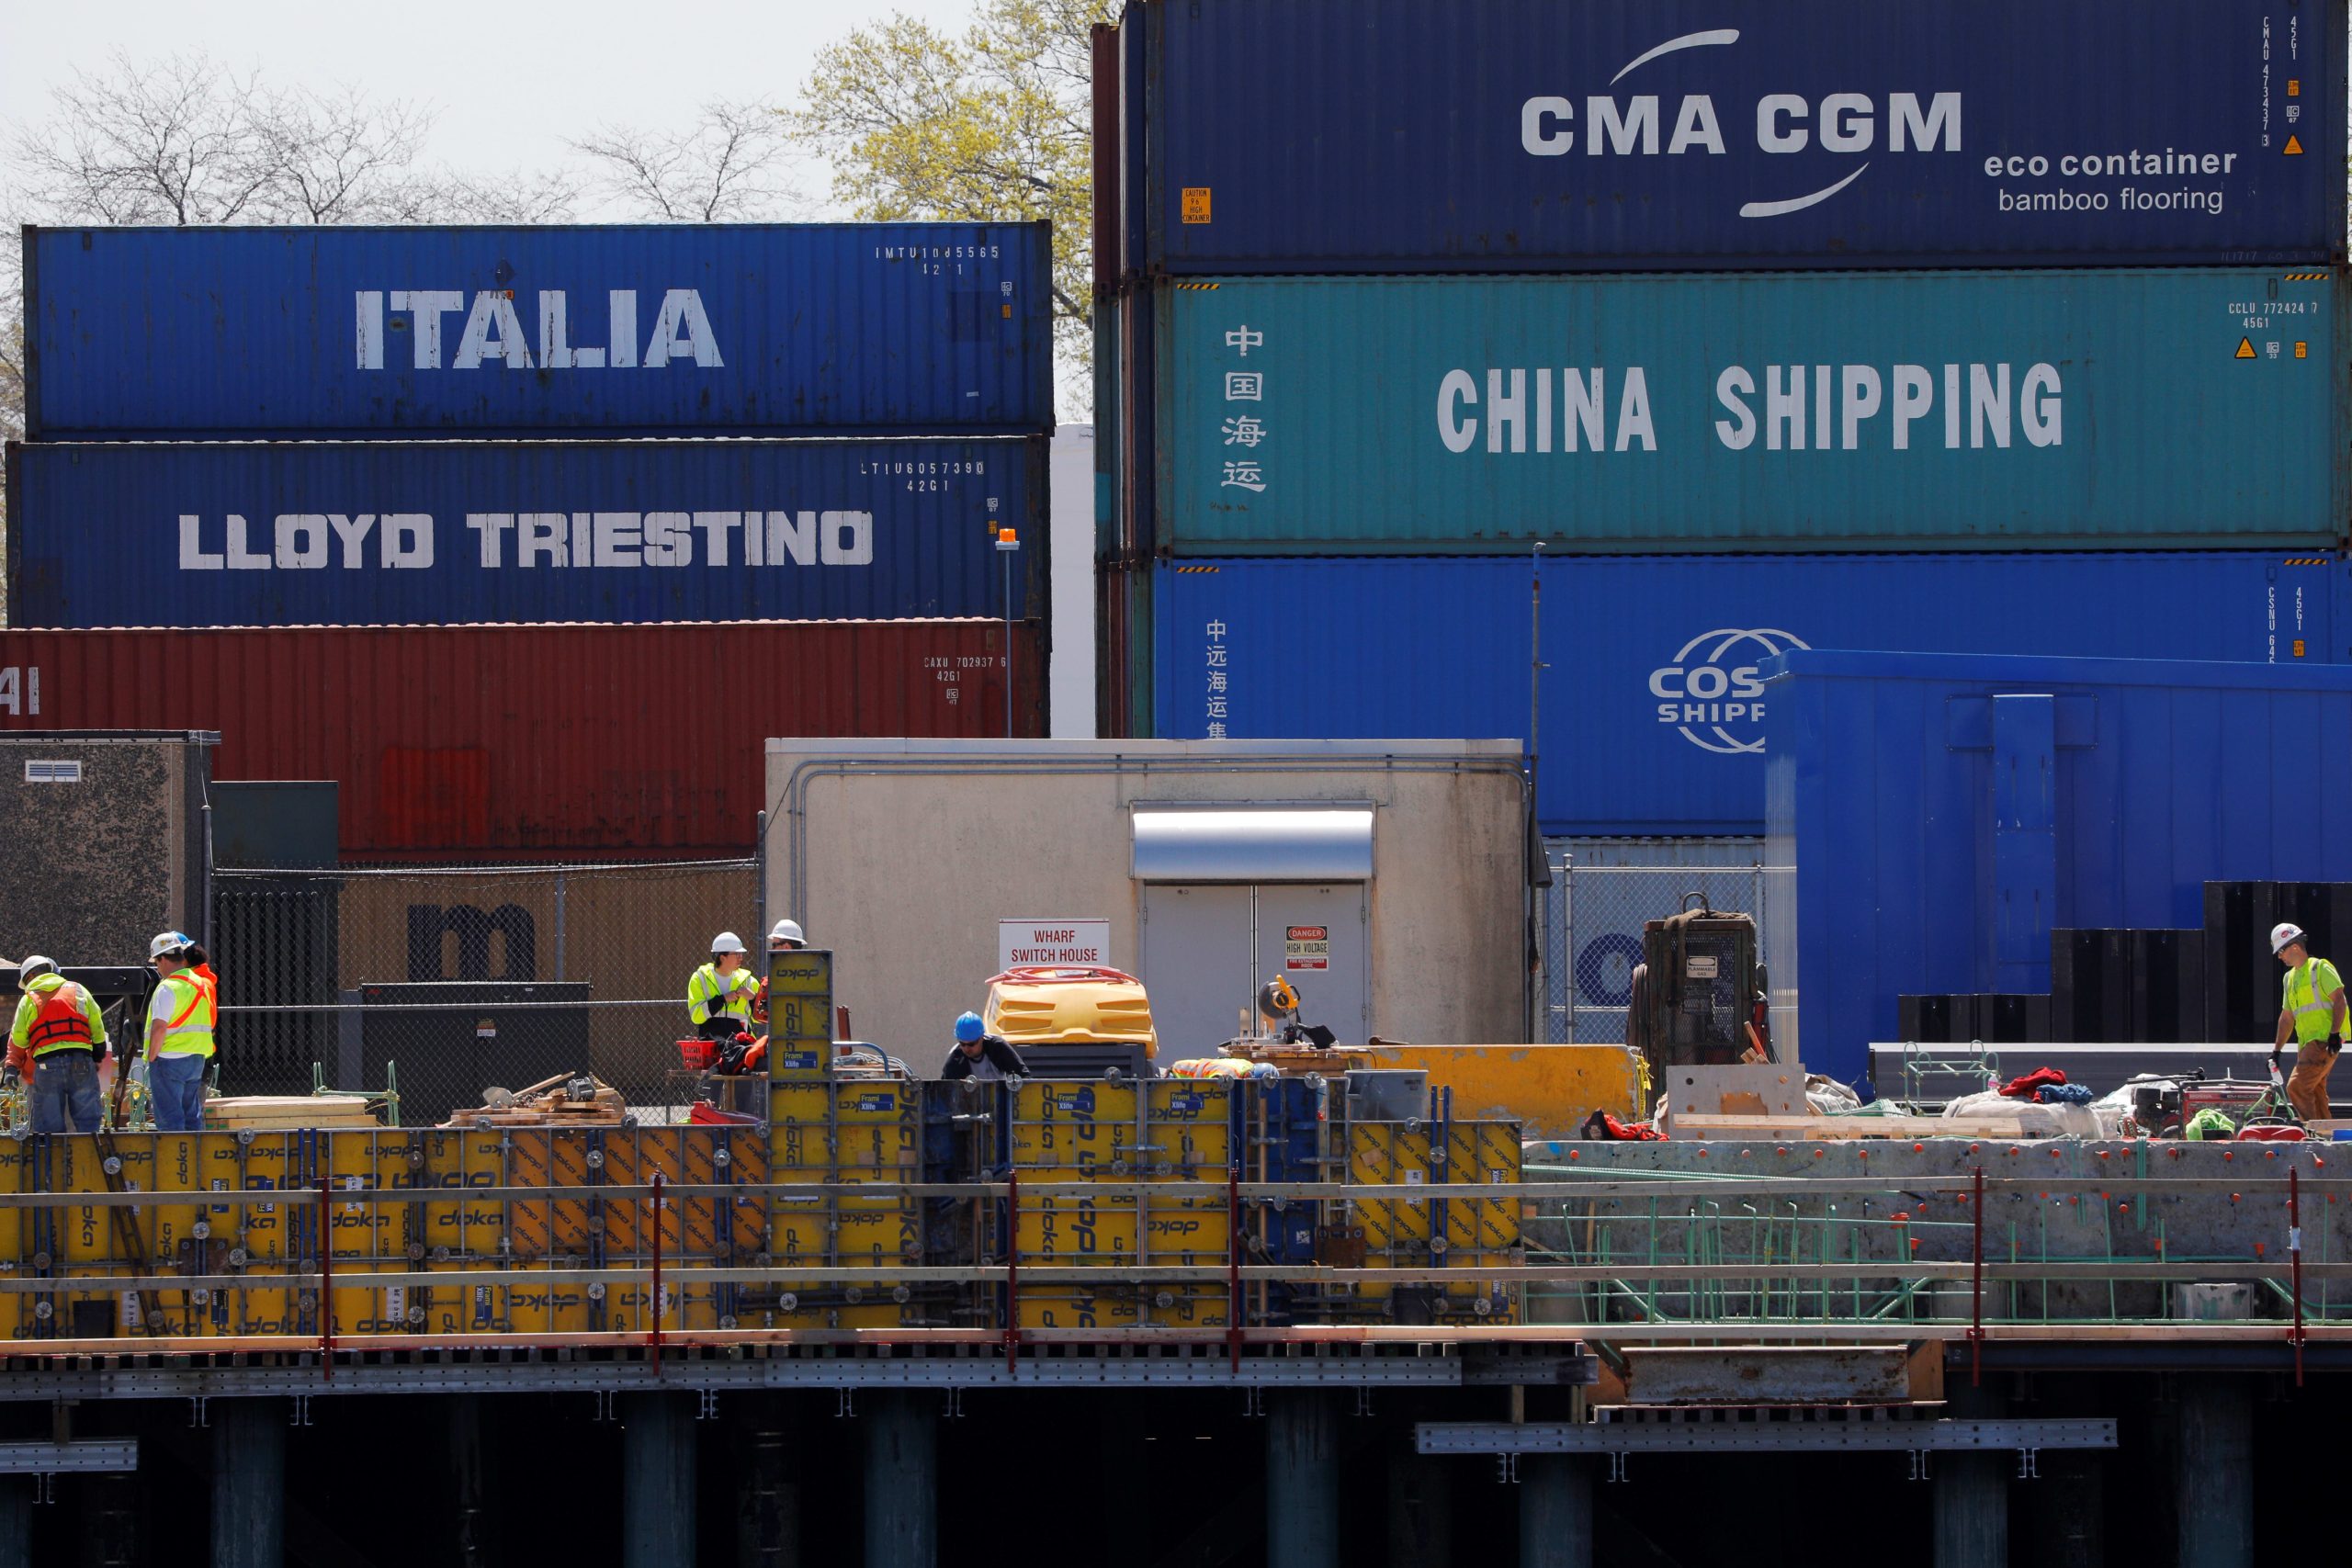
The consequence is severe. Bangladeshi tanners often sell uncertified leather to Chinese buyers at deep discounts, while the country later imports finished, certified leather to make shoes for Western brands. It produces a significant share of the world’s raw leather, yet captures only a small fraction of the global leather goods trade. A hide donated by a devout family to a madrasa or orphanage for charity passes through several intermediaries and is often sold for a price that barely covers the costs of salt, transport, and collection. The charity remains noble, but the economic stewardship fails.
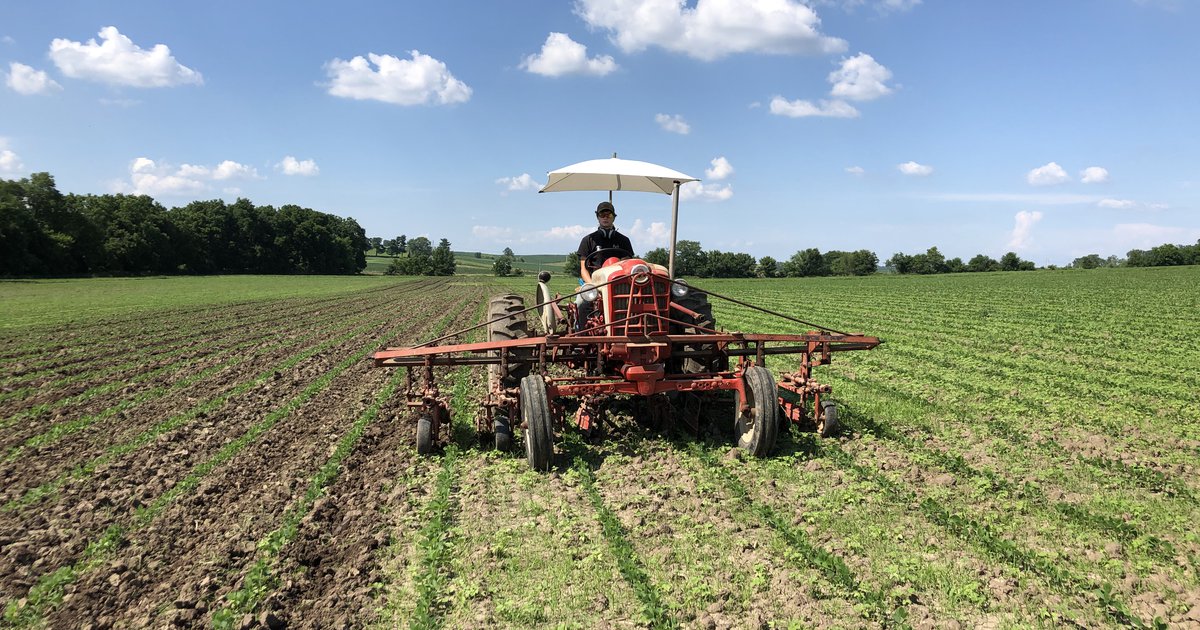
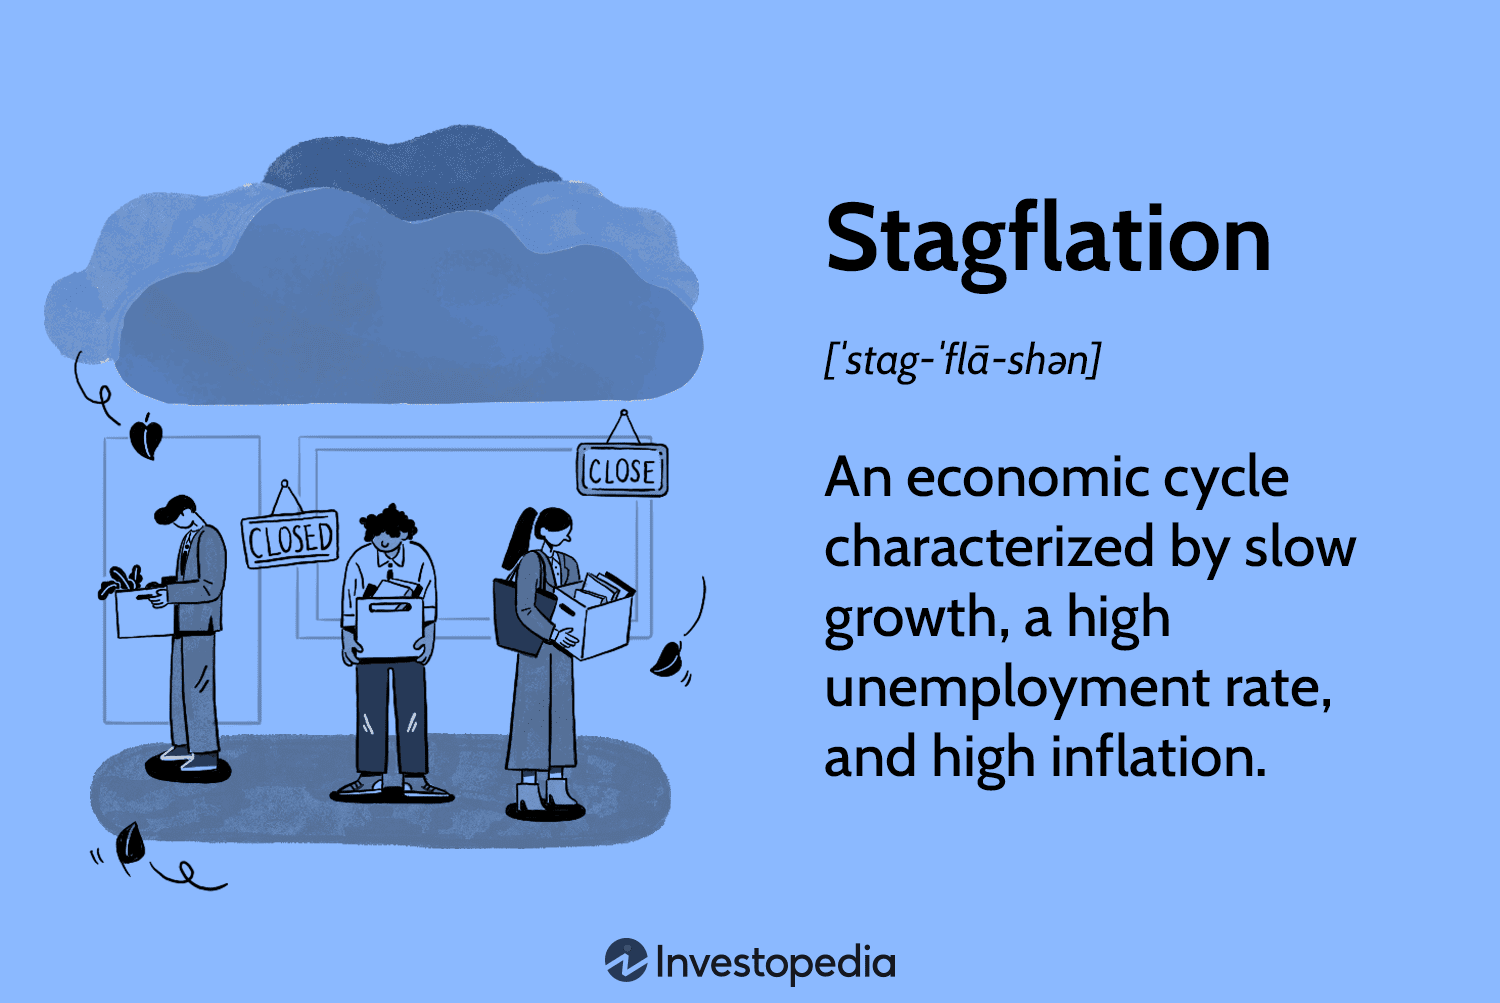
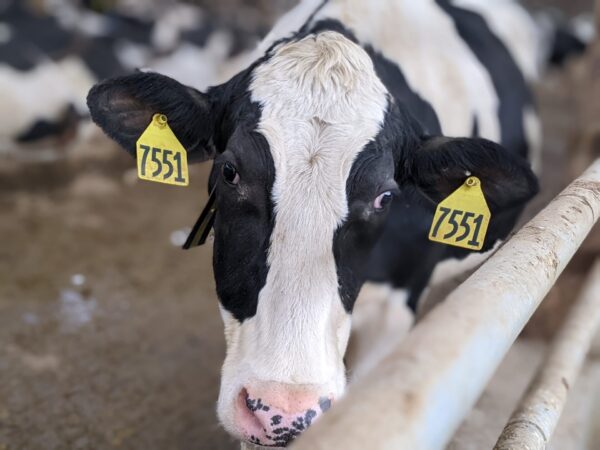
There is another warning sign: fewer households are participating in qurbani at the same level. Last year’s sacrifice figure of 91.36 lakh animals was more than 10 lakh less than the 2024 level. Farmers’ groups and livestock officials linked this decline to sustained inflation and weaker purchasing power among middle-class households, the constituency that anchors the qurbani market.
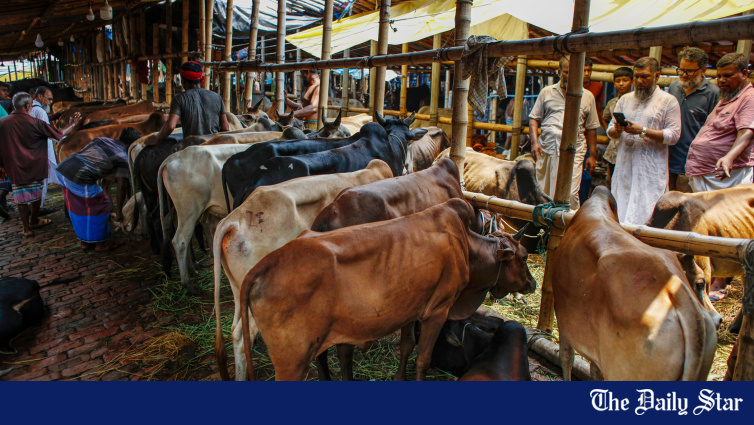
The behavioural response is visible in the cattle haats. Families that once bought a full cow now take shares in a collective animal. Others substitute goats for cattle or step out of the market altogether. This is the same affordability compression that left Bangladesh unable to fill its hajj quota in recent years. Pilgrimage and sacrifice are responding to the same macroeconomic squeeze, in the same season, among the same households. Reading them as separate stories is an analytical mistake with policy consequences.
Since the diagnosis is institutional, the cure must also be institutional. Three measures are overdue.
First, complete the Hemayetpur CETP, the solid-waste system, and the estate-level compliance process, then pursue the LWG certification as a national priority. Until that happens, every qurbani will continue to refill the pipeline that sells Bangladeshi rawhide at below-potential value. Certification would not require more animals; it would allow the same raw material to earn more.
Second, the government should stop treating qurbani rawhide as a charitable byproduct and start treating it as an industrial commodity with charitable ownership. The commerce ministry’s annual price floor should reflect the durable commercial worth of hide, not just post-Eid bargaining power. A modest salting, storage, and cold-chain support programme for madrasas, orphanages, and community collectors would reduce spoilage that destroys value after Eid. These institutions should not be forced to sell quickly at distress prices because they lack preservation capacity.
Third, Bangladesh should govern hajj and qurbani together. A statutory hajj management authority—learning from Malaysia’s Tabung Haji, established in 1969, and Indonesia’s BPKH, established in 2014—could ease the seasonal forex pressure through planned savings, better remittance scheduling, and prudent forward arrangements. A parallel Eid-ul-Azha logistics cell could coordinate livestock movement, rawhide preservation, urban waste management, and post-Eid collection. The two flows share a season, a currency exposure, and a constituency. They should not sit in separate ministries that rarely compare notes.
Qurbani is, first and last, an act of worship. Nothing in an economic argument diminishes that. But faith and stewardship are not in tension. A festival that mobilises millions of animals, sustains a billion-dollar export sector, and moves a meaningful share of the nation’s foreign exchange deserves to be administered with the seriousness Bangladesh extends to the RMG sector or remittances. We have measured the qurbani economy often enough. It is time to manage it.
Dr M Kabir Hassan is professor of finance and economics at the University of New Orleans in the US and recipient of the 2016 IDB Prize in Islamic banking and finance.
Views expressed in this article are the author’s own.
Follow The Daily Star Opinion on Facebook for the latest opinions, commentaries, and analyses by experts and professionals. To contribute your article or letter to The Daily Star Opinion, see our guidelines for submission.