Going into 2026, the setup around Bitcoin looked unusually clean. The October 2025 high above $126,000 had reinforced the idea that the next phase would be driven by easier policy, steady ETF demand, and the delayed effects of the halving cycle.
That backdrop did not hold for long. Inflation reappeared in the data, geopolitical tension escalated, and the Federal Reserve stopped moving. The shift was not gradual. It forced a repricing across risk assets and exposed a widening gap in the Bitcoin vs. gold dynamic.
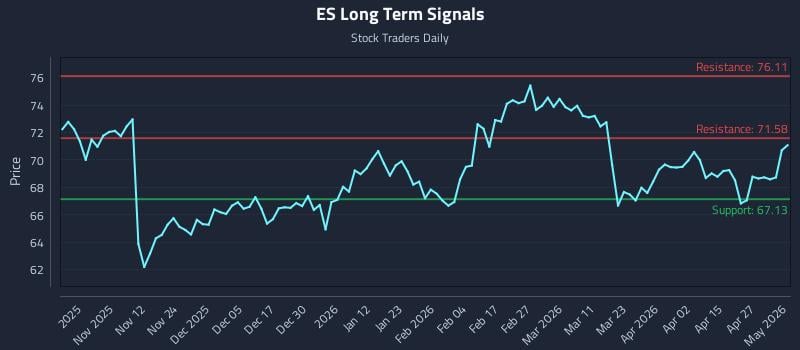
By late April, gold vs. Bitcoin performance no longer needs interpretation. Gold remains elevated in the high-$4,000s even after pulling back from a January spike above $5,300. Bitcoin, on the other hand, is trading closer to the mid-$70,000s after losing momentum early in the year. On any gold vs. Bitcoin chart, the divergence stands out without much context.
What drove Gold to record territory
Gold’s move has not been random. The sequence is familiar. Tensions in the Middle East toward the end of February pushed oil back above $100, which quickly fed into inflation expectations. Markets that had started to price in stability had to adjust again. The CPI print — 3.3% year-over-year with a 0.9% monthly increase — reinforced that shift.

Flows followed. The gold price vs. bitcoin spread widened as institutional positioning rotated. After several years of preference for equities and crypto, part of that capital moved back into gold. Central bank demand did not slow either, especially outside developed markets.
That matters for the broader crypto vs. gold hedge discussion. The two assets are often grouped together, but they react to different triggers. Gold tends to absorb slow, persistent pressure. Bitcoin needs a different backdrop. The gold market cap vs. Bitcoin market cap gap reflects that difference in positioning, not just scale.
Bitcoin’s identity crisis
The long-term case behind the Bitcoin vs. gold store of value narrative has not disappeared. Fixed supply and independence from central banks still define the asset. In inflation-driven environments, Bitcoin has delivered.
The issue in 2026 is the type of shock. This has not been a clean monetary cycle. It has been shaped by geopolitics and uneven liquidity. In that environment, Bitcoin has traded closer to a high-beta risk asset than a defensive one.
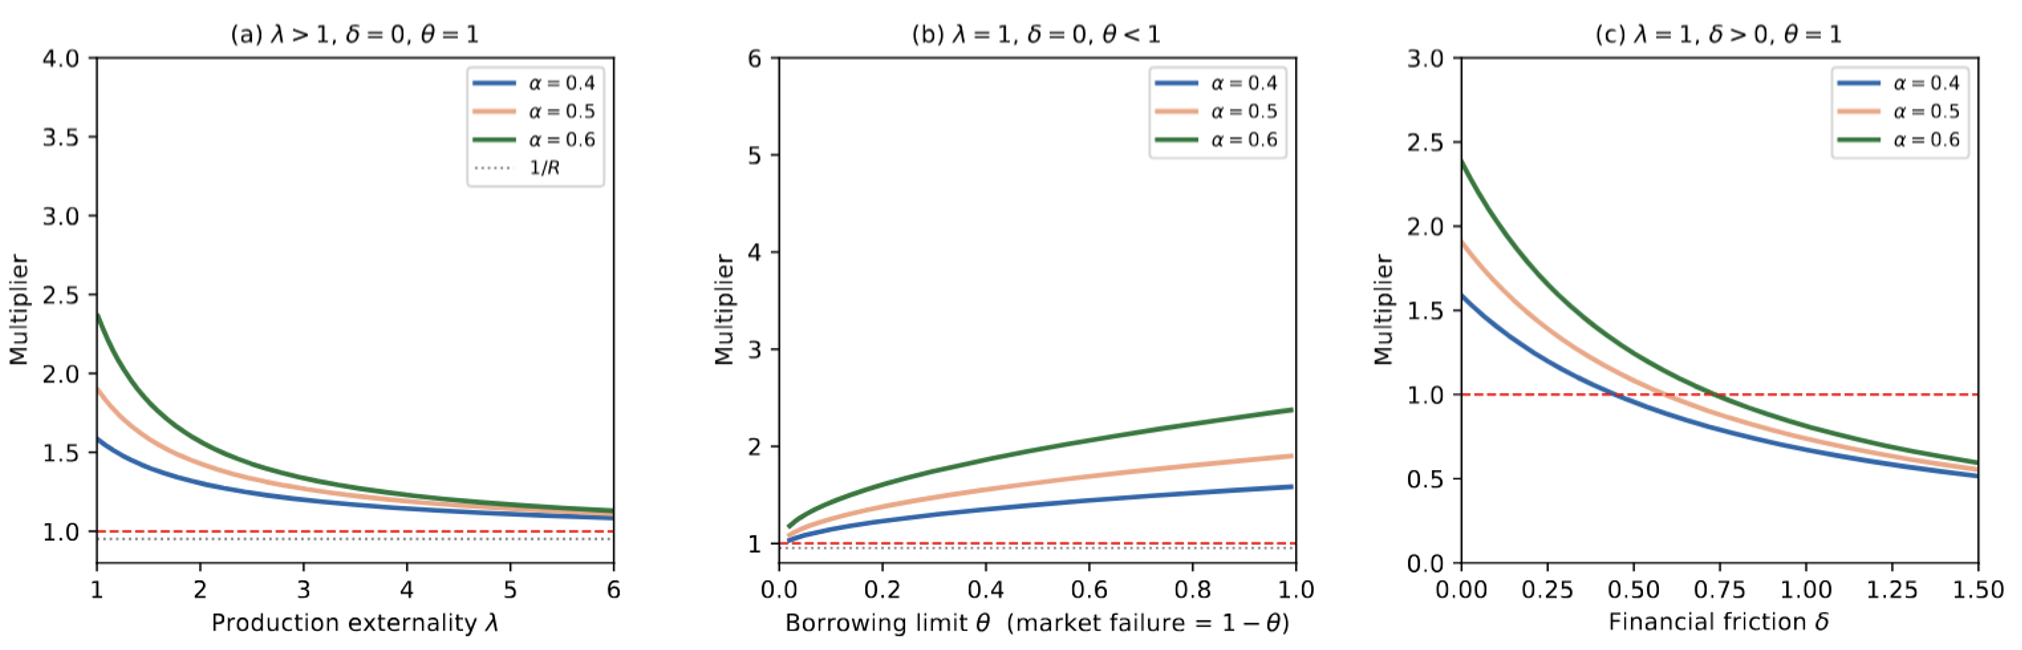
The pattern shows up in the trend. Bitcoin dropped sharply in January, extended losses in February, and failed to rebuild momentum through March. That behaviour lines up with findings in academic research: Bitcoin tends to respond differently depending on the nature of the shock. Inflation-driven moves can support it, while broader financial uncertainty often does the opposite (NCBI study).
The BTC/XAU comparison has reflected that split. Capital has leaned toward gold, while Bitcoin has struggled to attract consistent inflows. Saying that every dollar into gold equals a dollar out of Bitcoin is shorthand, not a literal flow match, but the direction is clear. On a Bitcoin vs. gold performance 2025-2026 basis, the contrast is difficult to ignore.
There was a brief deviation. In mid-January, Bitcoin held its ground during a Nasdaq pullback, which reopened the “digital gold” discussion. ETF inflows improved, and accumulation picked up. The move faded quickly, but it showed that the narrative is still conditional rather than broken.
The Fed trap and the liquidity question
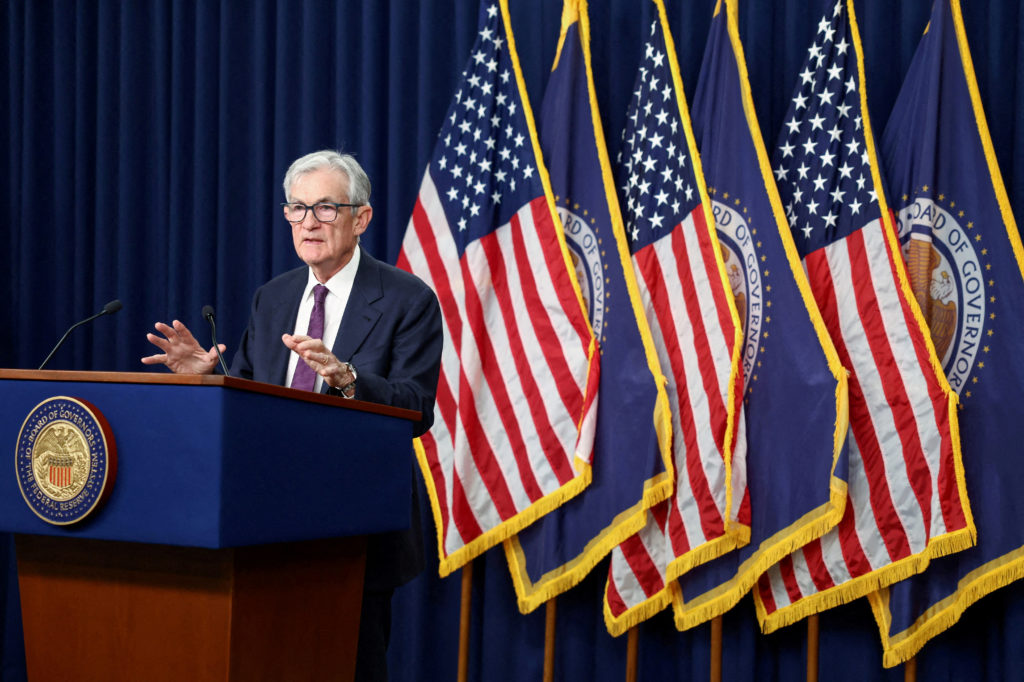
A large part of the divergence in the Bitcoin vs. gold chart can be traced back to policy expectations. After multiple cuts between late 2024 and the end of 2025, the Federal Reserve has shifted into a wait-and-see stance. The IMF’s April assessment made that explicit, noting limited room for further easing unless conditions deteriorate.

For Bitcoin, the link is straightforward. Easier policy supports liquidity and risk appetite. The reverse is equally true.
Liquidity expectations themselves are not settled. Some projections point to tighter conditions in the near term, which would keep pressure on risk assets. Others focus on potential offsets later in the year. Hilbert Group CIO Russell Thompson highlighted that tension in April, pointing to near-term pressure from liquidity tightening.
The long view: Ten years of diverging returns
Short-term price action can distort perspective. The Bitcoin vs. gold chart for 10 years tells a very different story. Bitcoin’s long-term performance remains far ahead of gold, which explains why institutional participation has not disappeared during the recent drawdown.
The trade-off between Bitcoin vs. gold discussion shifts when viewed through that lens. Some analysts frame Bitcoin’s upside in terms of volatility compression. If the asset were to behave more like gold in terms of risk, implied valuations would move significantly higher. One scenario discussed in early 2026 places that level around $266,000. It is not a forecast. It is a model outcome based on changing assumptions.
The Bitcoin market cap vs. gold market cap gap remains large enough to keep that argument alive. Whether it matters in the near term depends on macro conditions rather than theory.
Where capital is going right now
At this stage, the Versus Trade BTC XAU positioning is not ambiguous. Capital is leaning toward gold. The reason is situational, not structural. The current mix — persistent inflation pressure, geopolitical uncertainty, and limited policy flexibility — aligns with gold’s historical role.
That does not lock the trajectory. The Bitcoin vs. gold price chart for 2026 is still sensitive to shifts in expectations. Signs of stabilization have started to appear in Bitcoin as geopolitical risks evolve, and the Bitcoin vs. gold performance 2025–2026 narrative could change quickly if liquidity improves or policy signals shift.
What this period highlights is the difference in behaviour. The gold vs. bitcoin comparison is not about a single winner across all conditions. It is about alignment with the environment. Right now, that alignment favors gold.