What happened?
The Straits Times Index has continued to reach new record highs in July 2026.
Earlier, we highlighted three best-performing Singapore blue-chip stocks that gained more than 20% in 1H 2026.
We also looked at whether DBS, OCBC and UOB could continue to rise after all three banks reached record highs in July.
On the income side, we highlighted three Singapore blue chip stocks paying dividends in July, where SATS stood alongside Singtel and SIA Engineering as blue chips rewarding shareholders with higher payouts.
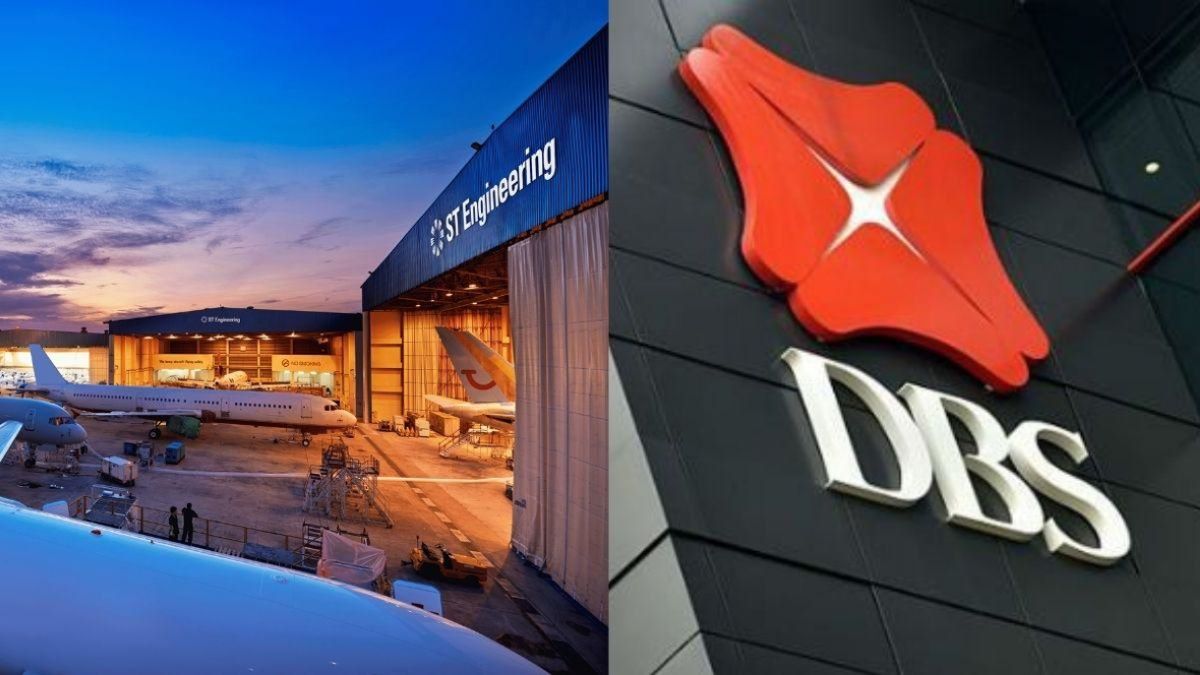
Among Temasek-linked STI stocks, DBS, ST Engineering and SATS were the strongest performers year-to-date, while Temasek holds significant stakes in all three and each pays regular dividends.
But for income investors, a strong share price run and a higher dividend are not enough on their own.
Using Beansprout’s Income Pot framework, I compare their earnings, financial health, dividend sustainability and current yields to assess which looks strongest for dividend income.
#1 – DBS Group Holdings (SGX: D05)
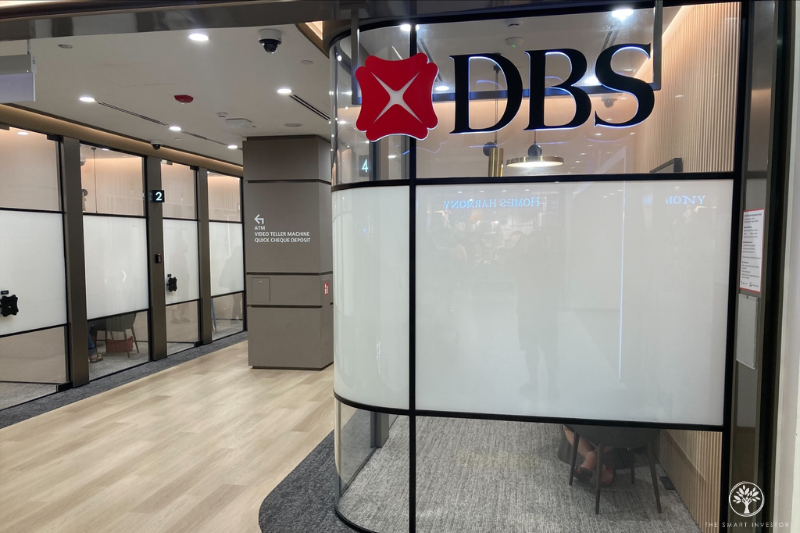
DBS is Singapore’s largest bank and the first SGX-listed company to cross S$200 billion in market capitalisation.
It reached this milestone on 13 July 2026, when its share price closed at S$70.79, up about 29.5% year-to-date.
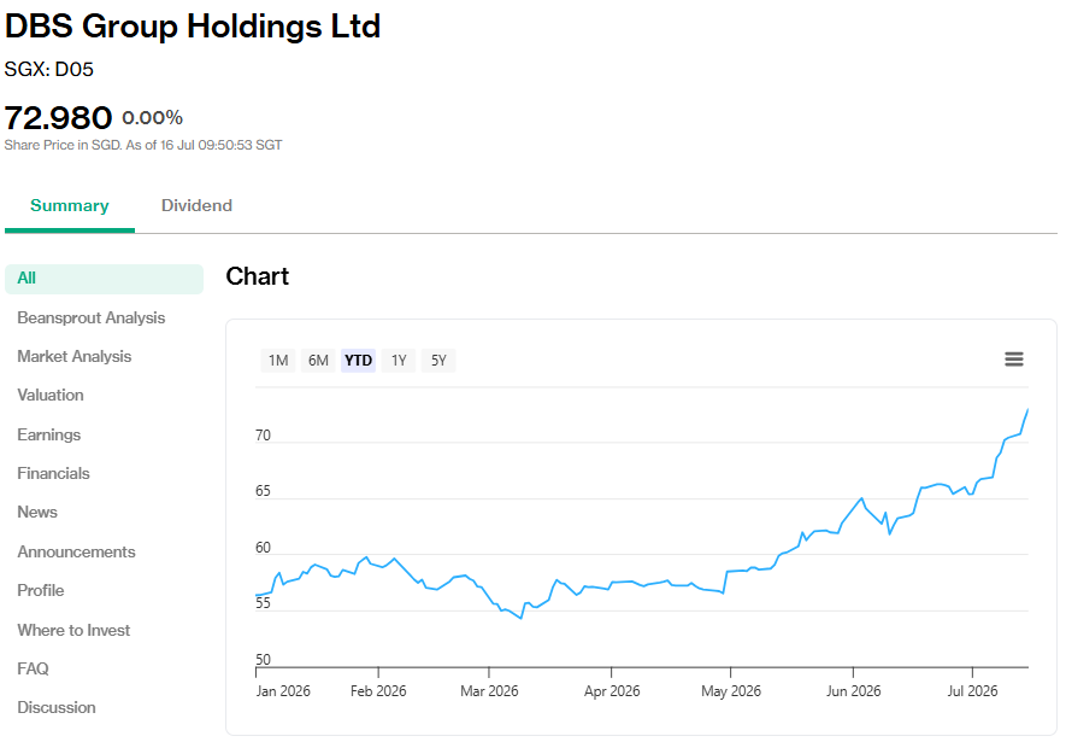
The rally has been supported by strong earnings expectations ahead of DBS’s 2Q2026 results on 6 August, with a number of sell-side analysts raising their price targets in recent weeks.
Temasek held about 28% of DBS as at 31 March 2026, making the bank one of the largest Singapore-based companies in its portfolio.
DBS was valued at a market capitalisation of S$161.8 billion on Temasek’s portfolio page as at the end of March, before its subsequent rally. The stake gives Temasek exposure to banking and wealth management growth in Asia.
DBS delivered a resilient 1Q2026 performance.
Net profit rose 1% year-on-year to S$2.93 billion, while total income reached a record S$5.95 billion.
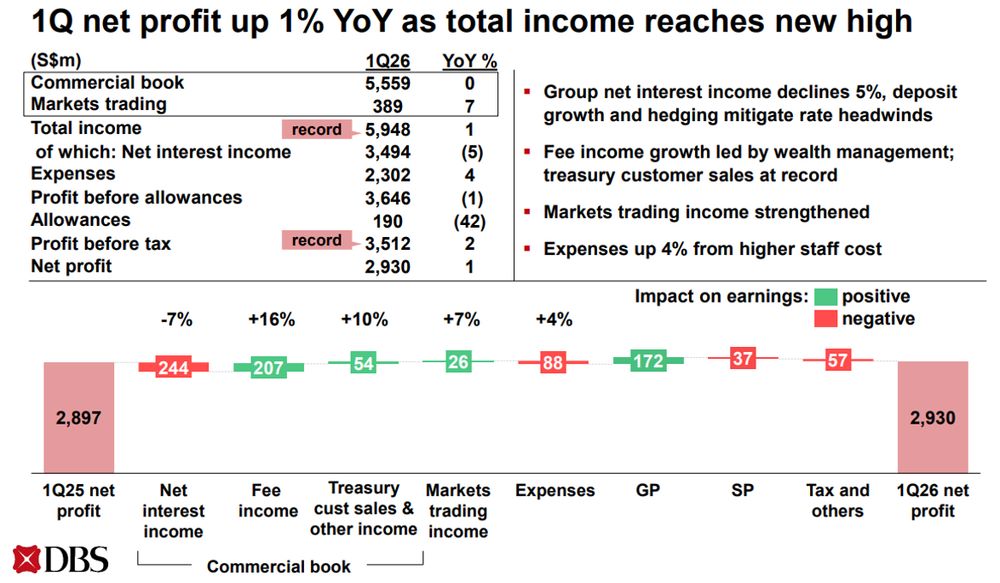
This was supported by record wealth management fees and treasury customer sales.
Return on equity stood at 17.0%, while return on tangible equity was 18.7%.
Fee income was a key bright spot.
Commercial book net fee income rose 16% year-on-year to S$1.48 billion, driven by record wealth management fees of S$907 million.
Loans grew 6% and deposits rose 12% in constant-currency terms from a year ago, while the cost-income ratio remained healthy at 39%.
Asset quality was stable.
The non-performing loan ratio stayed at 1.0%, while allowance coverage stood at 131%, or 200% after considering collateral.
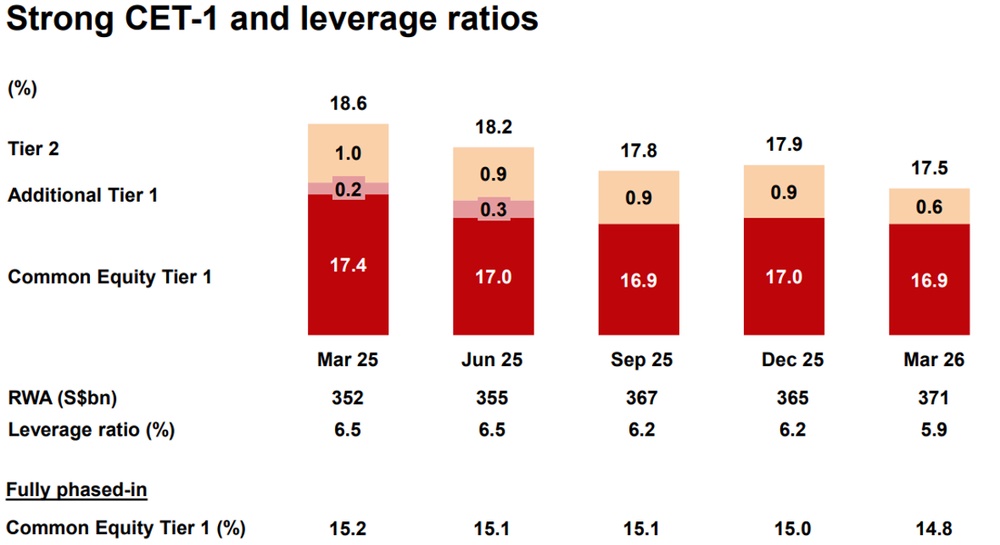
DBS also remained well capitalised, with a CET-1 ratio of 16.9% on a transitional basis, a liquidity coverage ratio of 151%, and a leverage ratio of 5.9%.
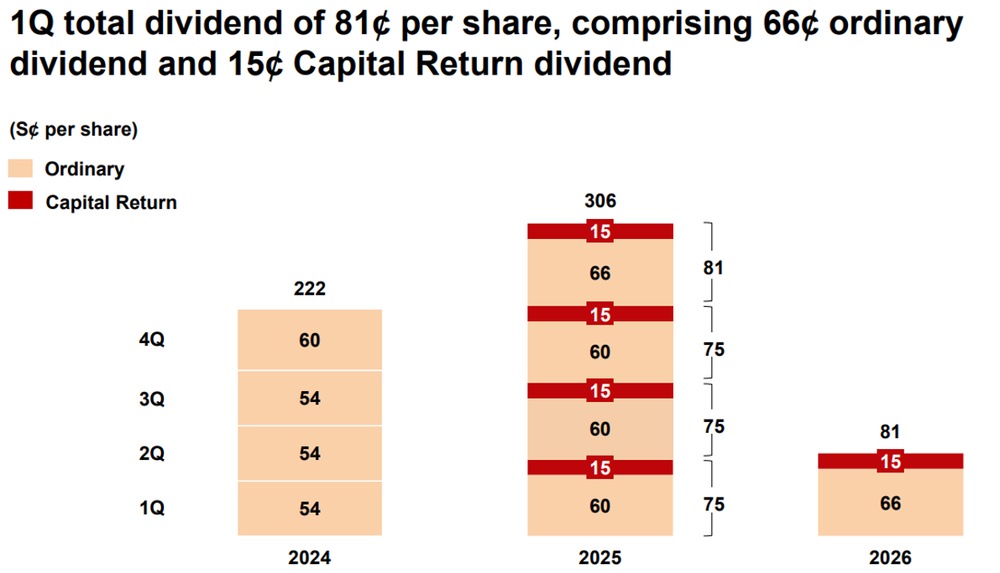
DBS declared an interim dividend of 66 cents per share and a Capital Return dividend of 15 cents, bringing its total 1Q2026 payout to 81 cents per share.
Together, DBS paid total dividends of S$3.06 per share for FY2025, including its Capital Return dividends. Based on its S$70.79 share price, this represents a trailing dividend yield of about 4.3%.
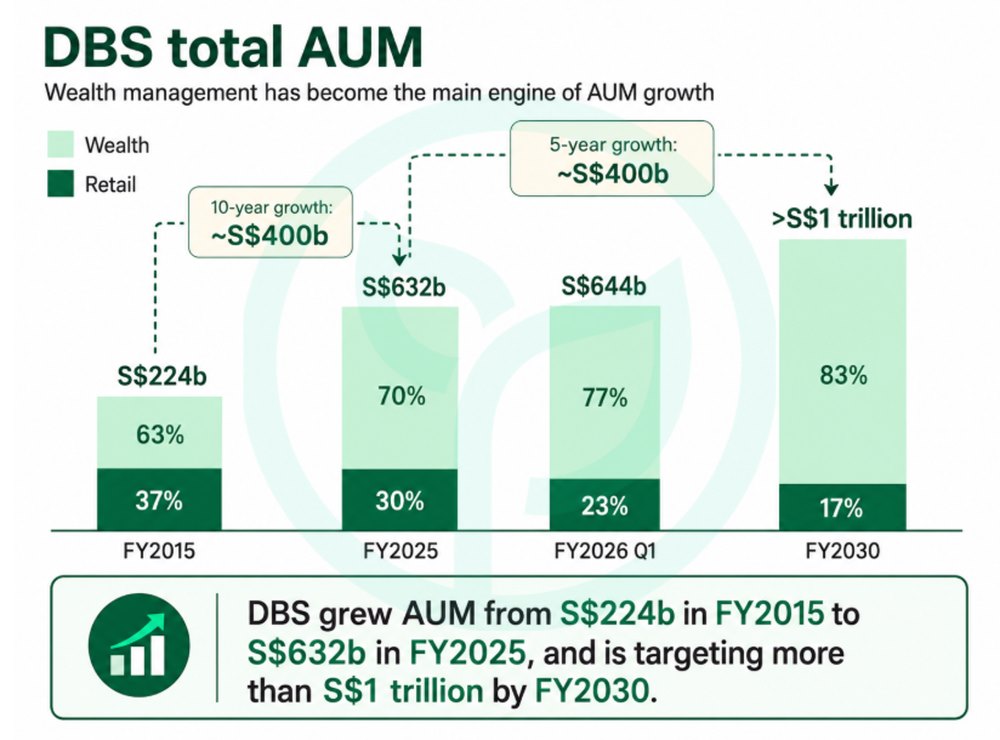
Beyond the latest results, DBS is expanding its wealth management franchise aggressively.
The bank is targeting more than S$1 trillion in retail and wealth assets under management by 2030, up from S$632 billion at end-2025.
It also plans to hire more than 600 relationship managers and platform engineers by end-2028.
This follows DBS’s earlier plan to open 18 new wealth centres and upgrade 36 existing centres across Singapore, Hong Kong, mainland China, India, Indonesia and Taiwan by 2027.
DBS is also pushing into new growth areas.
In July, it signed an MOU with Samsung Securities to explore cross-border wealth management collaboration between Singapore and South Korea.
It also announced plans to offer tokenised physical gold to retail customers through DBS digibank from the second half of 2026, backed one-for-one by physical gold held in a Singapore vault.
DBS screens well on Beansprout’s Income framework and passes all checks.
| Check | DBS |
| EPS growth | ✅ Pass — earnings remain resilient |
| Net debt to equity | ✅ Pass* — strong CET-1 ratio of 16.9% |
| Payout ratio | ✅ Pass — about 80% |
| Positive free cash flow | ✅ Pass* |
| Dividend yield | ✅ Pass — about 4.3% |
| Overall | 5/5 checks |
| Source: Beansprout | |
Earnings growth remains resilient. DBS reported 1Q2026 net profit of S$2.93 billion, supported by record total income, strong wealth management fees and treasury customer sales. Management has guided for FY2026 total income to be around 2025 levels, with the cost-income ratio in the low-40% range.
Financial health is strong. DBS had a CET-1 ratio of 16.9% and an NPL ratio of 1.0%, pointing to a well-capitalised balance sheet and stable asset quality. Allowance coverage of 131%, or 200% after considering collateral, also provides a buffer against unexpected credit losses.
DBS’ 1Q2026 return on equity stood at 17.0%, and the bank has consistently delivered ROE above 10% in recent years.
DBS had the highest FY2025 dividend payout ratio among the three banks at 80%, up from 56% in FY2024.
This reflects DBS’ higher shareholder returns, including its capital return dividend, supported by strong earnings and capital strength.
Based on estimates, DBS’ dividend payout ratio is expected to remain above 80% in 2026 and 2027.
Valuation is the main point to watch. Based on a trailing yield of about 4.3%, DBS clears our 3.5% income hurdle.
However, the strong share price rally has compressed its yield from earlier levels, though it still offers the highest FY2026 dividend yield among the three local banks.
Find out how much dividend income you would have received as a DBS shareholder over the past 12 months using the calculator below.
Related links:
#2 – ST Engineering (SGX: S63)
ST Engineering is a global technology, defence and engineering group with three main businesses: Commercial Aerospace, Defence & Public Security, and Urban Solutions & Satcom.
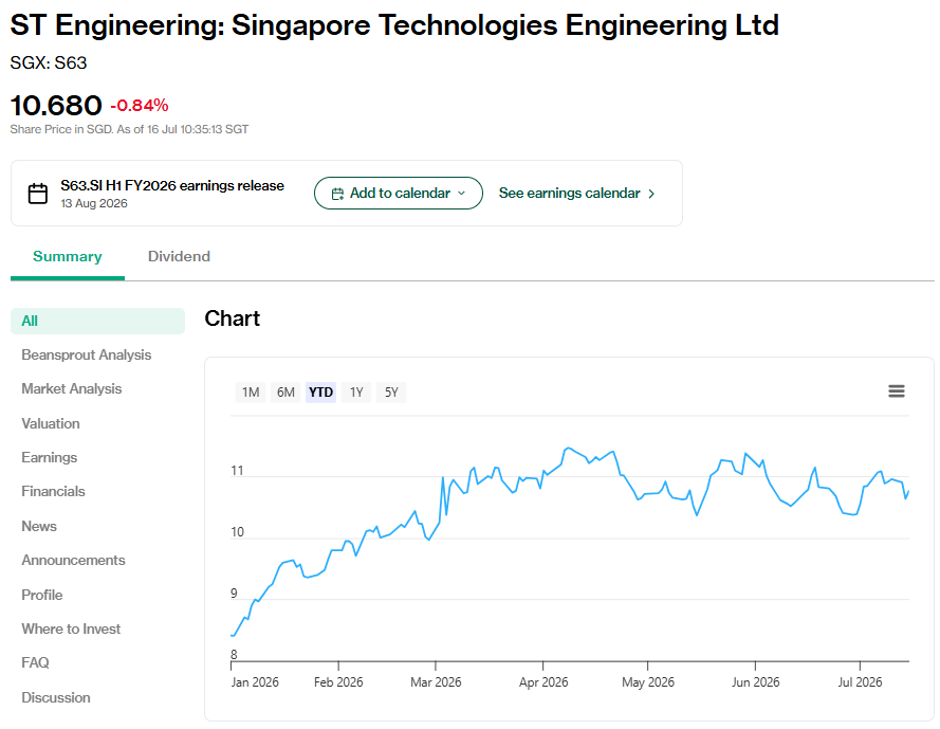
The stock had gained about 27.9% year-to-date by mid-July 2026, supported by stronger underlying earnings and a record order book.
Temasek held about 51% of ST Engineering as at 31 March 2026.
This makes ST Engineering the only majority-owned Temasek portfolio company among the three stocks in this article.
Temasek valued ST Engineering’s market capitalisation at S$33.8 billion as at the end of March and classified it under Transportation & Industrials.
Through ST Engineering, Temasek gains exposure to aerospace services, defence technology, public security and urban infrastructure.
However, majority ownership by Temasek does not guarantee ST Engineering’s dividends or investment returns.
The company must still convert its record order book into profitable revenue and cash flow while managing its debt.
For FY2025, headline profit was affected by one-off items.
Reported net profit fell 34% year-on-year to S$463 million, mainly due to S$689 million of non-cash impairment losses, largely related to its Satcom business.
This was partly offset by S$301 million of divestment gains from the sale of LeeBoy, STARCO, SPTel and CityCab.
However, the underlying picture was stronger.
On a Base Operating Performance basis, which excludes these one-off items, net profit rose 21% to a record S$851 million.
Revenue grew 9% year-on-year to S$12.35 billion.
Order momentum was also strong.
ST Engineering’s order book reached a record S$33.2 billion as at end-2025, supported by a 49% increase in new contract wins to S$18.7 billion for the year.
This momentum continued into 2026.
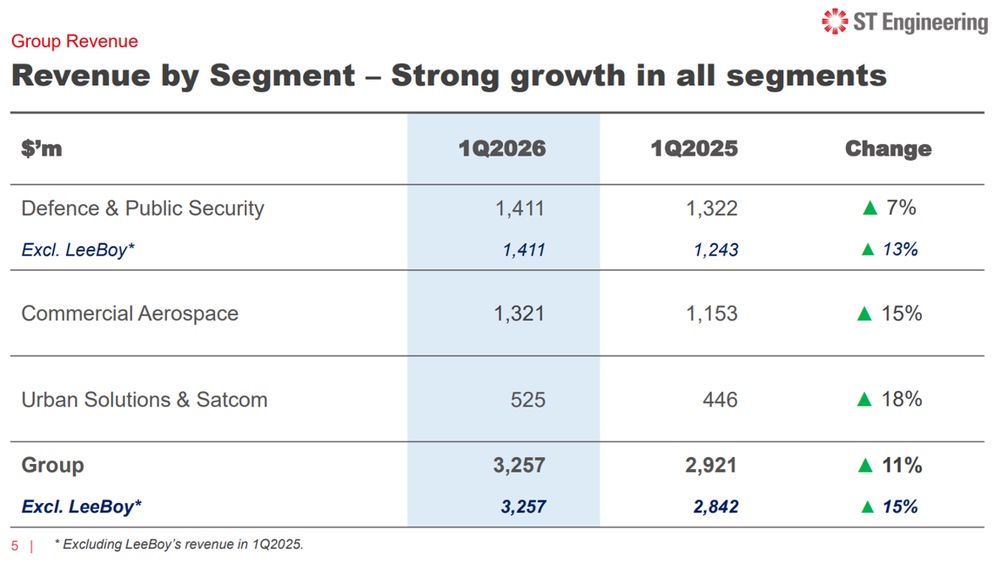
In 1Q2026, group revenue rose 11% year-on-year to S$3.26 billion, or 15% excluding the divested LeeBoy business.
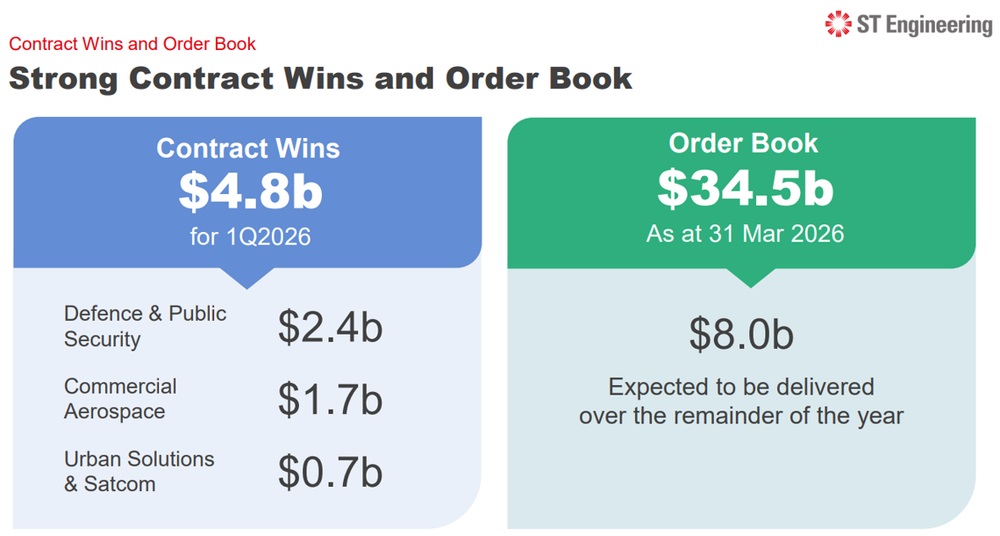
Growth was broad-based across all three segments, while the order book rose further to S$34.5 billion as at end-March.
New contract wins reached S$4.8 billion during the quarter.
Recent wins include a five-year contract worth about S$470 million to support the Qatar Emiri Land Forces, and a five-year contract worth about US$87 million to supply the UK Ministry of Defence with 40mm grenades.
The balance sheet has also improved.
Total borrowings fell to S$4.8 billion at end-2025 from S$5.8 billion a year earlier, helped by proceeds from divestments.
Gross Debt/EBITDA on a Base Operating Performance basis improved to 2.7 times from 3.6 times.
ST Engineering also carries strong credit ratings of Aaa/stable from Moody’s and AA+/stable from S&P.
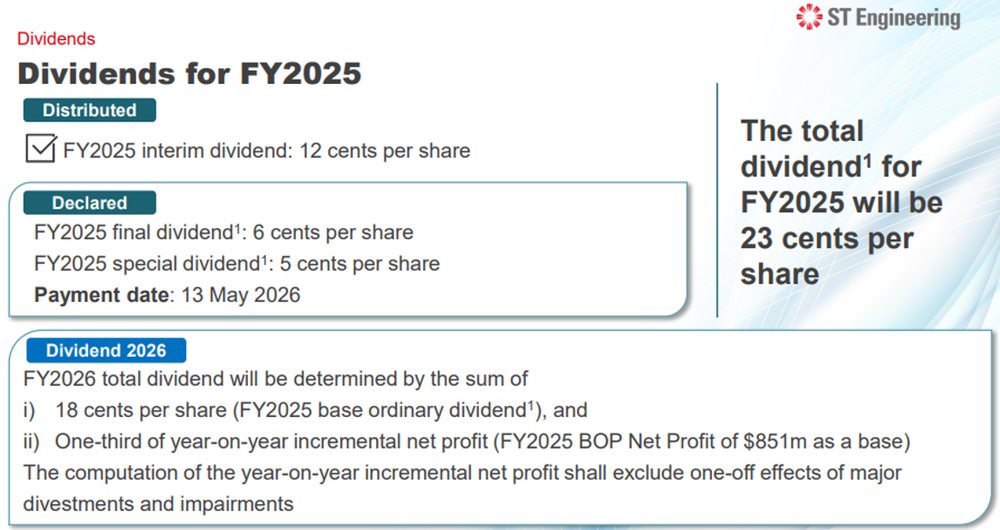
For FY2025, ST Engineering paid total dividends of 23.0 cents per share, up from 18.0 cents in FY2024.
This comprised 12.0 cents of interim dividends, a final dividend of 6.0 cents and a special dividend of 5.0 cents.
Based on the average share price for FY2025, this represented a dividend yield of about 3.52%.
However, at a more recent share price of around S$11.15, the trailing yield is closer to 2.1%, reflecting the strong share price rally.
From FY2026, ST Engineering has introduced a progressive dividend policy.
The ordinary dividend will comprise a base dividend of 18 cents per share, plus one-third of the year-on-year increase in Base Operating Performance (BOP) net profit per share.
This links future dividends more directly to earnings growth.
The group has already declared a 1Q2026 interim dividend of 4.0 cents per share.
Based on Beansprout’s Income framework, ST Engineering does not pass all checks.
| Check | ST Engineering |
| EPS growth | ✅ Pass — BOP net profit rose 21% in FY2025 |
| Net debt to equity | ❌ Fail — 1.65x |
| Payout ratio | ✅ Pass — about 84% based on BOP earnings |
| Positive free cash flow | ✅ Pass — strong operating cash flow supported dividends |
| Dividend yield | ❌ Fail — about 2.1% |
| Overall | 3/5 checks |
| Source: Beansprout | |
Earnings growth looks strong on an underlying basis. On a Base Operating Performance (BOP) basis, net profit rose 21% in FY2025 to a record S$851 million, supported by growth across all three business segments.
However, reported net profit fell sharply due to one-off impairments, which is a reminder that headline earnings can be volatile.
Financial health has improved, but leverage remains worth watching. Gross Debt/EBITDA on a BOP basis fell to 2.7 times from 3.6 times, helped by divestment proceeds and debt reduction.
ST Engineering’s strong credit ratings of Aaa/stable from Moody’s and AA+/stable from S&P also provide reassurance on balance sheet strength.
However, net debt to equity stood at 1.65 times as at FY2025, above our 1.0 times threshold.
The payout ratio is the main area to watch. On reported earnings, FY2025 dividends exceeded net profit, which would usually be a concern.
On a BOP net profit basis, the payout ratio was closer to 84%. This is more sustainable than the reported payout ratio, but still on the higher side.
The new progressive dividend policy, which links ordinary dividends to BOP earnings growth, should provide better visibility on future payouts.
Free cash flow remains positive. ST Engineering generated S$1.7 billion of operating cash flow in FY2025, alongside S$0.7 billion of divestment proceeds.
This comfortably supported dividends and debt reduction.
The main challenge is yield. At a trailing dividend yield of about 2.1%, ST Engineering falls short of our 3.5% income hurdle.
This reflects the strong share price re-rating, after ST Engineering delivered a total shareholder return of 84.2% in FY2025.
Overall, ST Engineering looks more like a defensive dividend growth stock than a high-yield income stock at current levels.
Find out how much dividend income you would have received as an ST Engineering shareholder over the past 12 months using the calculator below.
Related links:
#3 – SATS (SGX: S58)
SATS is one of the world’s largest air cargo handlers and Asia’s leading airline caterer.
Following its acquisition of Worldwide Flight Services in 2023, the combined SATS-WFS network now spans more than 225 stations across 27 countries.
The group operates across two main businesses: Gateway Services, which covers cargo and ground handling, and Food Solutions, which covers aviation and non-aviation catering.
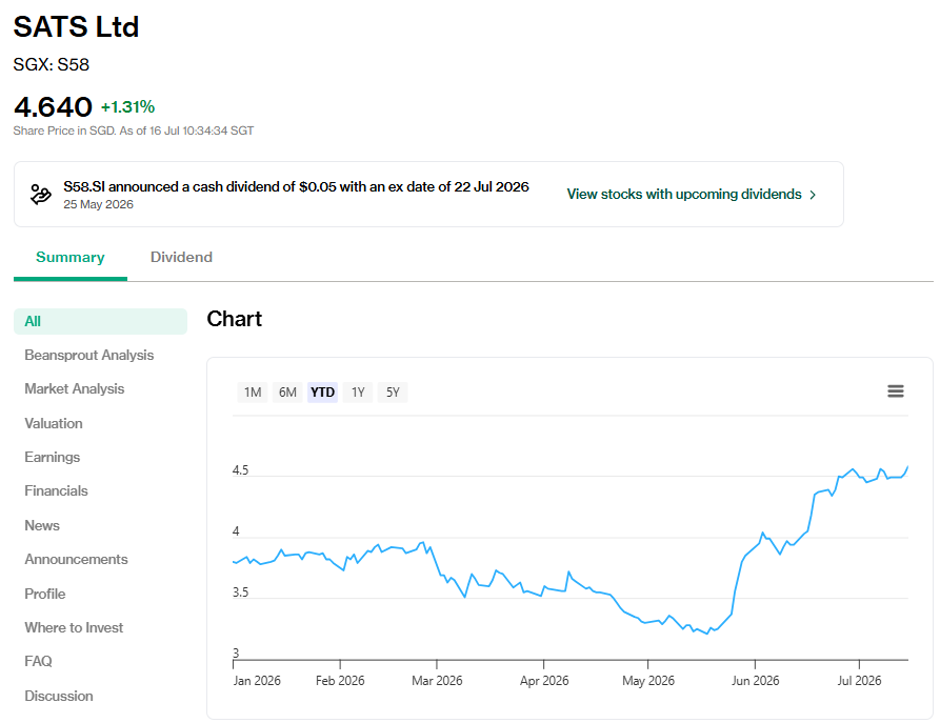
Its share price had risen about 20.2% year-to-date by mid-July 2026, supported by an improvement in earnings and dividends.
Temasek held about 40% of SATS as at 31 March 2026, making it a significant shareholder in the aviation services group.
Temasek valued SATS’s market capitalisation at S$5.2 billion as at the end of March and classified it under Transportation & Industrials.
SATS gives Temasek exposure to global air cargo, ground handling and food solutions.
For income investors, the key question is whether SATS can continue integrating WFS, reducing its debt and rebuilding its dividend.
For the financial year ending 31 Mar 2026, SATS delivered record results.
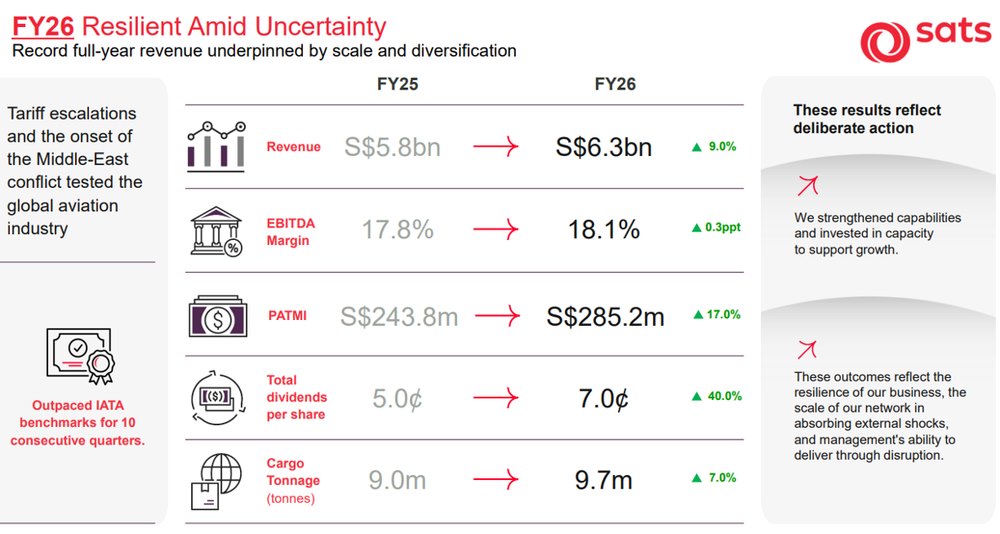
Revenue rose 9.0% year-on-year to S$6.35 billion, supported by growth across both business segments.
Gateway Services revenue grew 10.8% to S$4.95 billion, driven by cargo volumes that outperformed IATA’s global growth benchmarks for a 10th consecutive quarter.
Food Solutions revenue increased 2.9% to S$1.39 billion.
Profitability also improved.
EBITDA rose 10.6% to S$1.15 billion, while EBITDA margin expanded from 17.8% to 18.1%.
Operating profit increased 14.2% to S$543.3 million, while PATMI rose 17.0% to a record S$285.2 million.
The final quarter was more mixed.
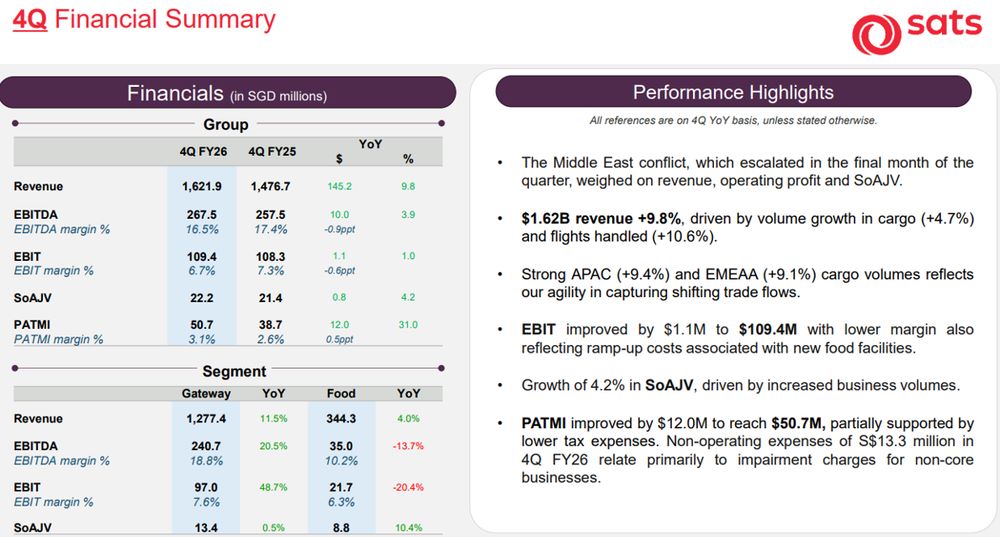
4Q FY2026 revenue rose 9.8% to S$1.62 billion, but the Middle East conflict weighed on revenue, costs and associate earnings in the final month of the quarter.
Flight cancellations by Gulf carriers affected cargo flows, while jet fuel shortages and higher energy costs added pressure.
EBIT margin narrowed from 7.3% to 6.7%, partly due to ramp-up costs at new food facilities.
Still, PATMI rose 31.0% to S$50.7 million, helped by lower tax expenses.
Management has described the impact of the conflict as manageable, given SATS’s diversified global network and its ability to capture cargo rerouting opportunities through alternative corridors.
SATS proposed a final dividend of 5.0 cents per share, up from 3.5 cents a year earlier.
This brought the FY2026 total dividend to 7.0 cents per share, a 40% increase year-on-year.
Based on SATS’s share price of S$4.57 as at 15 July 2026, this translates to a trailing dividend yield of about 1.5%.
The yield remains modest, but the payout ratio is still low relative to earnings, leaving room for dividends to grow if cash flow continues to improve.
The balance sheet is also gradually improving.
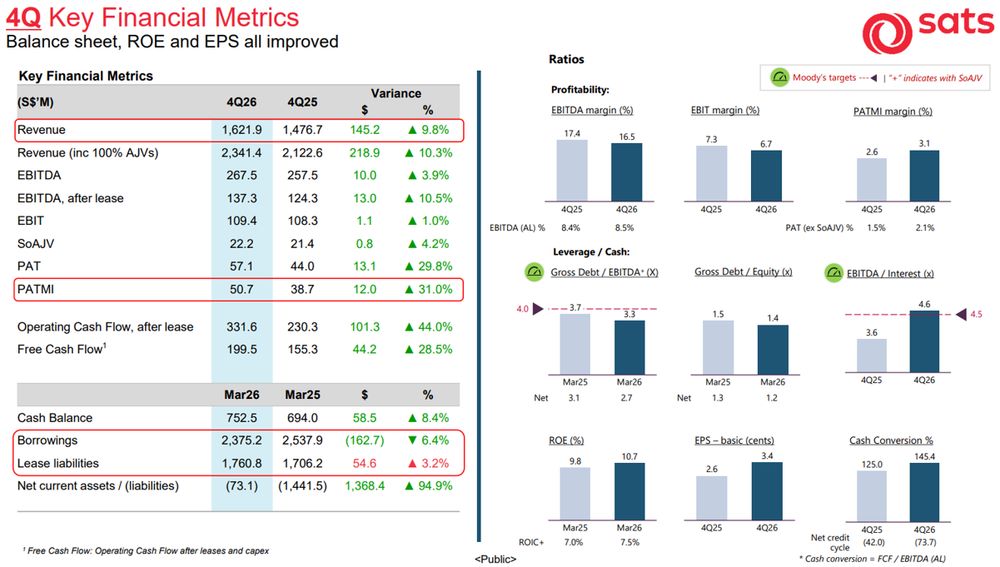
Gross debt to equity fell to 1.41 times from 1.53 times a year earlier.
Management is targeting a Gross Debt/EBITDA ratio of below 3.5 times by FY2029, down from 4.6 times in FY2024.
Return on equity improved to 10.7% from 9.8%, moving closer to the group’s FY2029 target of above 15%.
Free cash flow was S$215.8 million in FY2026, slightly below S$228.3 million in FY2025, as stronger operating cash flow was offset by higher capex for facility expansions, including new kitchens in Tianjin and Bangalore.
Based on Beansprout’s Income framework, SATS does not pass all checks.
| Check | SATS |
| EPS growth | ✅ Pass — PATMI rose 17% in FY2026 |
| Net debt to equity | ✅ Pass — 0.59x |
| Payout ratio | ❌ Fail — about 37% |
| Positive free cash flow | ✅ Pass — S$215.8 million |
| Dividend yield | ❌ Fail — about 1.5% |
| Overall | 3/5 checks |
| Source: Beansprout | |
Earnings have recovered strongly. SATS’ PATMI rose from S$53.2 million in FY2024 to S$243.8 million in FY2025 and S$285.2 million in FY2026, supported by the WFS integration and continued recovery in travel-related demand.
However, this is more of a turnaround story than a steady multi-year growth trend, as FY2024 was still coming off a weak post-pandemic base.
Financial health has improved. Gross debt to equity fell to 1.41 times from 1.53 times, while net debt to equity stood at 0.59 times, below our 1.0 times threshold.
SATS is also tracking towards its FY2029 target of Gross Debt/EBITDA below 3.5 times, suggesting that the balance sheet has continued to de-risk after the WFS acquisition.
The payout ratio remains conservative. SATS’ payout ratio of about 37% is slightly below our 40% baseline.
This explains the modest yield today, but also gives SATS room to raise dividends if earnings and cash flow continue to improve.
Free cash flow remains positive. FY2026 free cash flow was S$215.8 million, slightly lower than the previous year due to higher capex on facility expansions.
However, operating cash flow after lease payments rose 24.6% to S$560.5 million, suggesting that underlying cash generation remains healthy.
The main challenge is yield. At a trailing dividend yield of about 1.5%, SATS falls well short of our 3.5% income hurdle.
Overall, SATS looks more like an earnings recovery and dividend growth stock than a pure income stock today.
Find out how much dividend income you would have received as a SATS shareholder over the past 12 months using the calculator below.
Related links:
What would Beansprout do?
DBS, ST Engineering and SATS have each delivered strong share-price gains in 2026, but their dividend income profiles remain very different.
Temasek’s shareholdings provide useful context on the companies’ significance within its portfolio.
However, I would not consider a stock for my Income Pot as part of Beansprout’s four pots of wealth based on Temasek’s ownership alone.
Among the three, DBS offers the strongest income profile today.
DBS continues to deliver resilient earnings, supported by record total income and strong wealth management fees, while its CET-1 ratio of 16.9% and NPL ratio of 1.0% point to a solid balance sheet.
Its payout ratio rose to 80% in FY2025, but its trailing dividend yield of about 4.3% still clears our 3.5% income hurdle. Learn more about DBS’s latest valuation and dividend analysis here.
ST Engineering also has strong underlying earnings, healthy free cash flow and a record order book, but its net debt-to-equity ratio of 1.65 times and dividend yield of about 2.1% miss our thresholds.
At current prices, it looks more like a defensive dividend growth stock than a high-yield Income Pot holding. Learn more about ST Engineering’s latest valuation and dividend analysis here.
SATS clears three checks, supported by a strong earnings recovery, a lower net debt-to-equity ratio of 0.59 times and positive free cash flow.
However, its payout ratio of about 37% is slightly below our 40% baseline, while its 1.5% dividend yield falls well short of our income hurdle.
SATS therefore looks more like an earnings recovery and dividend growth story than a pure income stock. Learn more about SATS’s latest valuation and dividend analysis here.
Overall, DBS offers the most mature income profile, while SATS and ST Engineering may better suit investors seeking earnings recovery, dividend growth or order-book momentum.
You can learn more about the five checks I use to screen dividend stocks for the Income Pot here.
| Stock | Dividend yield | Key strength | Key risks |
| DBS (D05) | ~4.3% |
|
|
| ST Engineering (S63) | ~2.1% |
|
|
| SATS (S58) | ~1.5% |
|
|
Overall, these Temasek-backed blue chips support our view that Singapore stocks are still worth looking at in 2026.
Earlier, we shared that we would consider looking beyond Singapore REITs to Singapore blue chip stocks for more diversified dividend income, especially when the dividends are supported by earnings growth, strong balance sheets and sustainable payout ratios.
By combining different sources of dividends, investors may be able to build a more resilient income portfolio over time. Learn how to build a more dependable stream of income that can hold up across cycles here.
If you’d like to screen for other Singapore stocks with attractive dividend yields and potential upside, you can explore our Singapore high dividend stocks screener.
Which of these Temasek-backed blue chips are you watching for your income pot? Share your thoughts in the comments below or join the discussion in our Telegram group!
Planning to invest in Singapore stocks? Compare the best Singapore brokers to find the right trading platform, and see the latest promotions and sign-up rewards available.
Follow Beansprout on YouTube, Facebook and Instagram, and add Beansprout as your preferred source on Google so you never miss an update.