Some things are so rare that they warrant attention when they occur. Investors are seeing that happen this year.
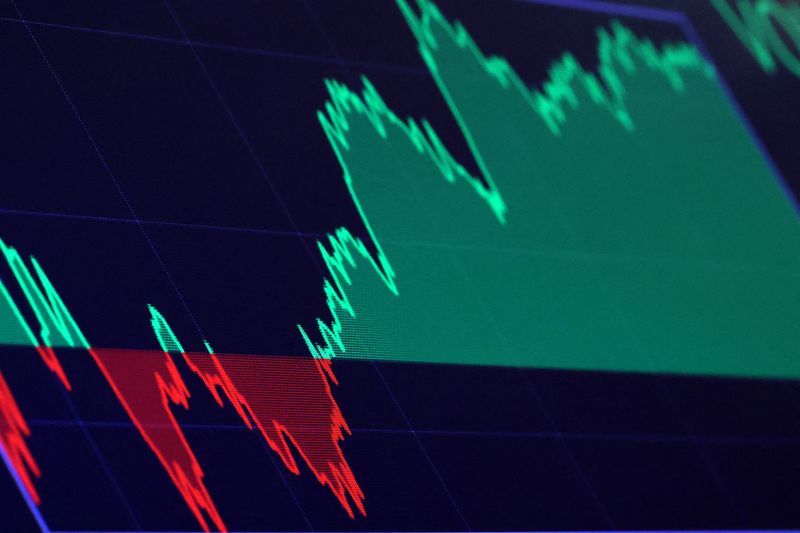
The Shiller S&P 500 (SNPINDEX: ^GSPC) CAPE (cyclically adjusted price-to-earnings) ratio, named for economist Robert Shiller, measures the S&P 500’s price against inflation-adjusted earnings over a rolling 10-year period. This metric has topped 32 only five times since 1871. We’re living through the fifth period right now.
Missed Nvidia in 2009? This Rare Signal Is Flashing Again. In 2009, a “Double Down” signal flashed for a little-known chipmaker called Nvidia. For the first time in years, that same “Total Conviction” signal is flashing for a company 1/100th the size of Nvidia. Continue »
This elevated CAPE ratio has served as a warning signal in the past, with stock market crashes often following. However, two stocks stand out for surviving (and, ultimately, thriving) every time.
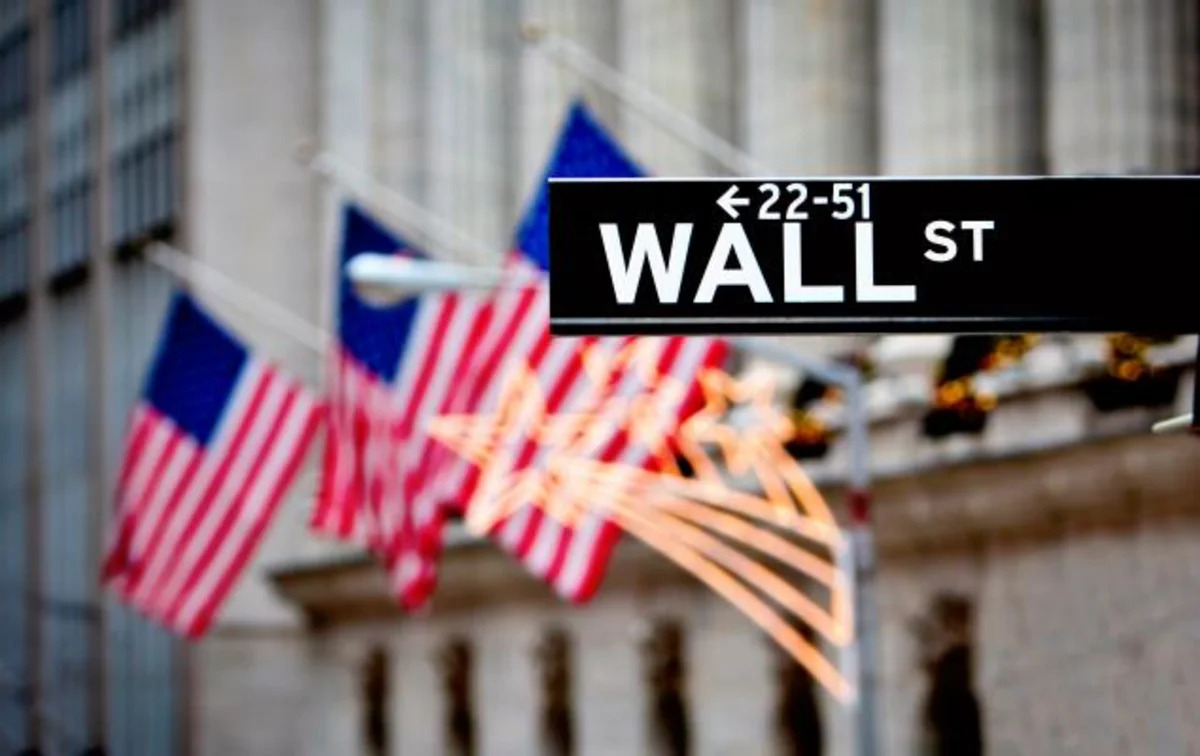
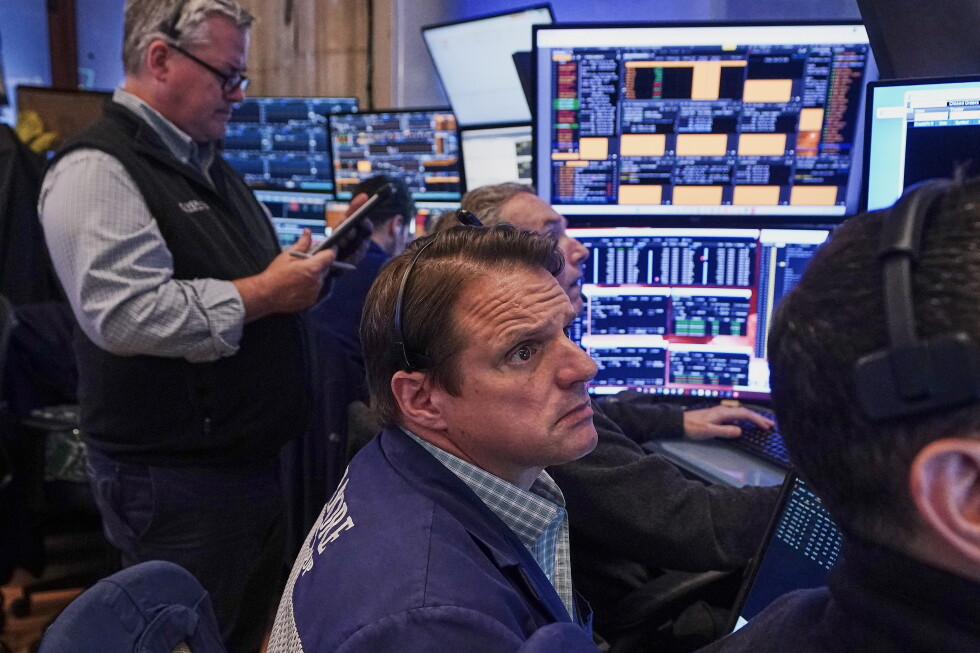
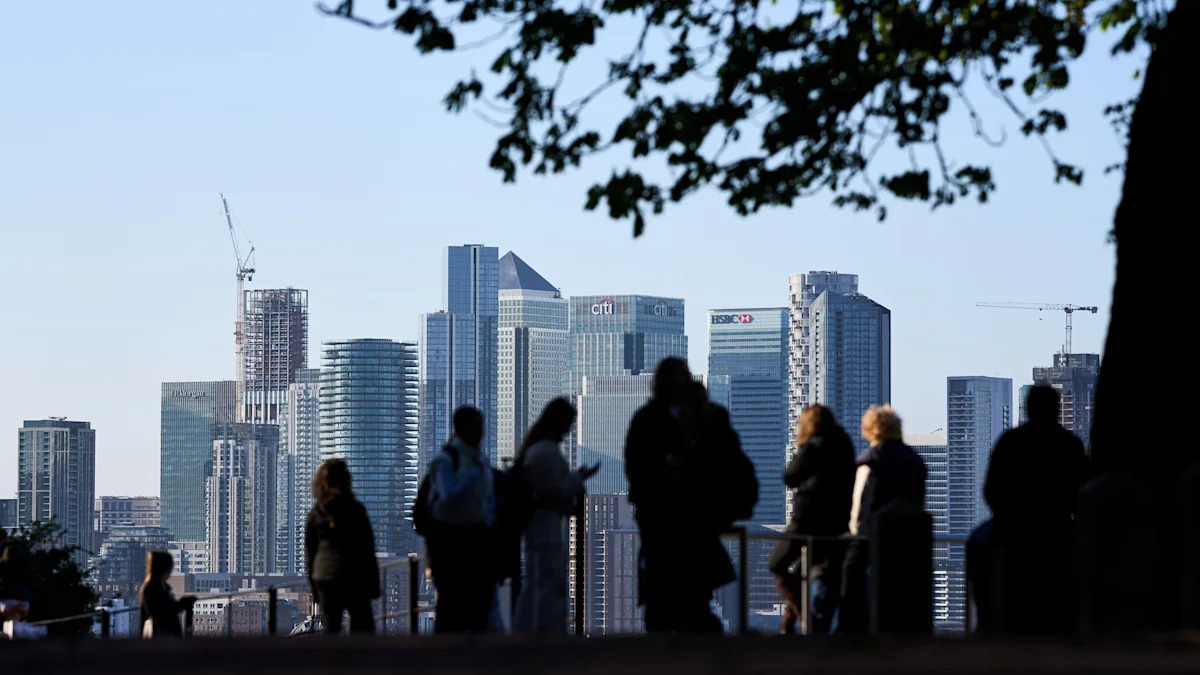
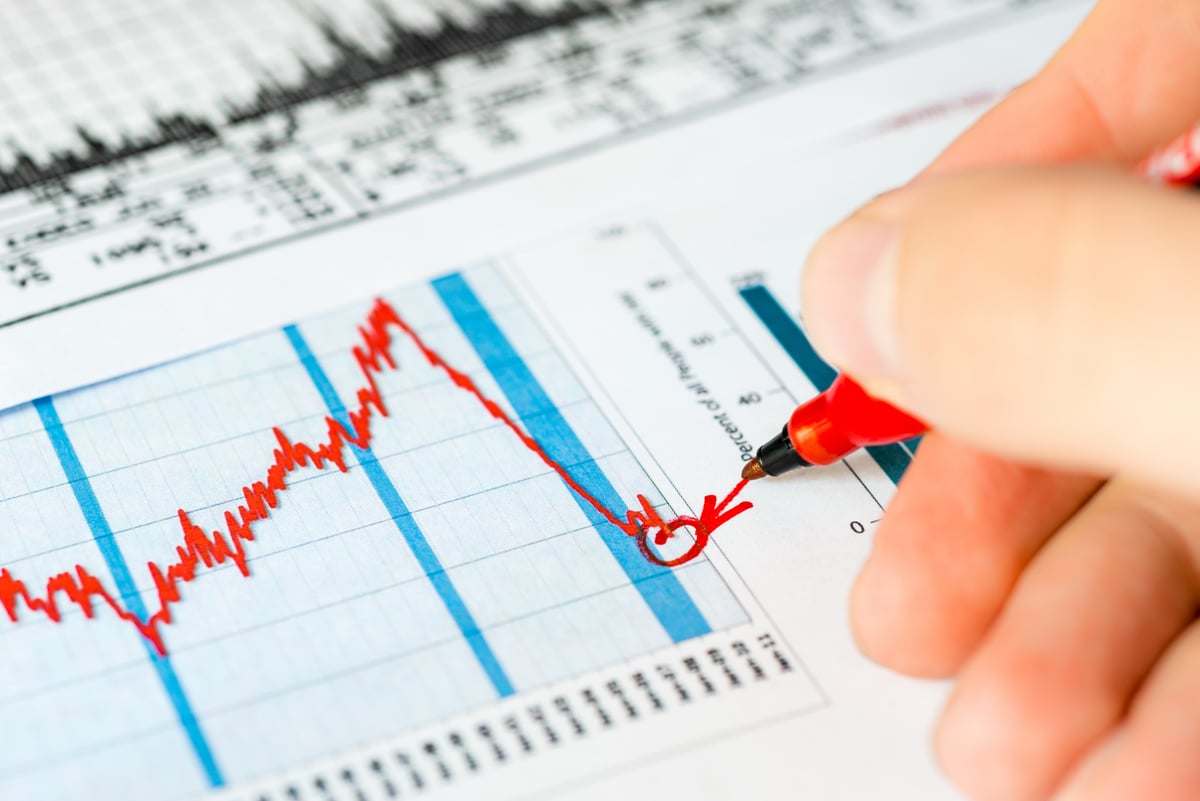
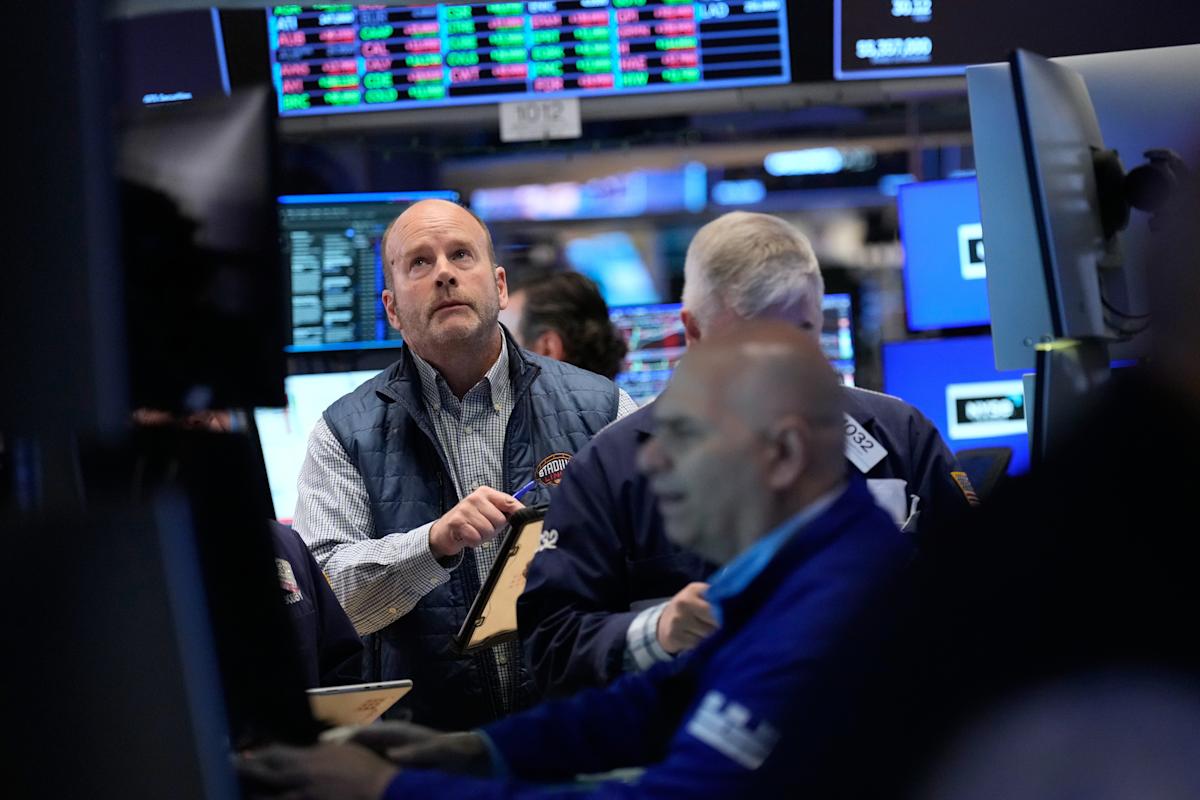
Image source: Getty Images.
CAPE fear
Between 1871 and 1928, the CAPE ratio never rose much above 25. That changed in 1929. By October of that year, the valuation metric surged to around 32.6. Students of stock market history know what happened next: the steep market crash of 1929 that preceded the Great Depression.
Stock prices plunged more than 30% by the end of 1929 after climbing sharply in the months leading up to the crash. The CAPE ratio had reflected a significantly higher market valuation than normal and provided a warning for anyone who paid attention.
Almost seven decades passed by before the Shiller S&P 500 CAPE ratio again crossed above 32. The metric reached that level in 1997 and continued to rise. By the end of 1999, the CAPE ratio was at an all-time high of 44.2.
Again, this elevated level served as an ominous warning. The dot-com bubble burst in 2000. It took nearly eight years for the S&P 500 to fully recover.
The CAPE ratio also hit 32 at the end of 2017. While it briefly fell below the level a few months later, the valuation metric quickly bounced back. This time, the S&P 500 didn’t crash. However, the index experienced a significant pullback in the final months of 2018 and temporarily entered into correction territory.
In late 2020, the Shiller S&P 500 CAPE ratio once again topped 32. Investors’ initial worries about the COVID-19 pandemic had faded. The market was booming. By late 2021, the CAPE ratio was at its second-highest level ever. And history repeated itself: the S&P 500 sank 19% in 2022.
Blue chip survivors
Most of the companies with their shares listed on the major U.S. stock exchanges today didn’t exist in 1929 when the CAPE ratio first crossed the 32x threshold. But two blue chip stocks survived all previous times when Shiller’s valuation metric warned of a market downturn: The Coca-Cola Company (NYSE: KO) and Procter & Gamble (NYSE: PG).
To be sure, both Coca-Cola and P&G stocks took a hit during the 1929 crash and the Great Depression. They weren’t immune to the sell-offs when the dot-com bubble burst or the bear market of 2022, either.
However, these two companies’ businesses remained remarkably resilient. Coca-Cola and P&G kept on paying dividends. They even continued to increase their dividends throughout the turbulent periods.
Both are Dividend Kings, an elite group of stocks that have increased their dividends for at least 50 consecutive years. Coke’s streak of dividend hikes currently stands at 64 years, while P&G’s record is an even more impressive 70 years.
Each stock has also made patient investors a lot of money. An initial investment of $10,000 in either Coca-Cola or P&G stock in 1990 would be worth more than $400,000 today, assuming dividends are reinvested.
Two key takeaways
Investors can learn two important lessons from all this.
First, high market valuations usually lead to steep declines. The Shiller S&P 500 CAPE ratio shouldn’t be ignored. Importantly, though, the stock market can be priced at a premium for an extended period before the eventual mean reversion occurs.
Second, buying the stocks of high-quality companies and holding them for the long term pays off. It’s no accident that Coca-Cola and Procter & Gamble survived the past market declines and ultimately thrived. Both companies sell products that customers want and have built strong moats.
Maybe the current sky-high CAPE ratio won’t trigger a market crash. But if it does, stocks such as Coca-Cola and P&G are likely to survive and thrive again.
Should you buy stock in Coca-Cola right now?
Before you buy stock in Coca-Cola, consider this:
The Motley Fool Stock Advisor analyst team just identified what they believe are the 10 best stocks for investors to buy now… and Coca-Cola wasn’t one of them. The 10 stocks that made the cut could produce monster returns in the coming years.
Consider when Netflix made this list on December 17, 2004… if you invested $1,000 at the time of our recommendation, you’d have $371,842!* Or when Nvidia made this list on April 15, 2005… if you invested $1,000 at the time of our recommendation, you’d have $1,244,783!*
Now, it’s worth noting Stock Advisor’s total average return is 900% — a market-crushing outperformance compared to 207% for the S&P 500. Don’t miss the latest top 10 list, available with Stock Advisor, and join an investing community built by individual investors for individual investors.
Keith Speights has no position in any of the stocks mentioned. The Motley Fool has no position in any of the stocks mentioned. The Motley Fool has a disclosure policy.