TradingKey – Since April 2025, copper prices have accumulated a gain of over 60%, with the core driving factor being the continuously growing market demand for copper amid the ongoing development of AI.
With the rapid development of AI in recent years, it has not only driven demand for chips, servers, and optical modules, but is also reshaping power systems, with copper being one of the most critical metals in power infrastructure.
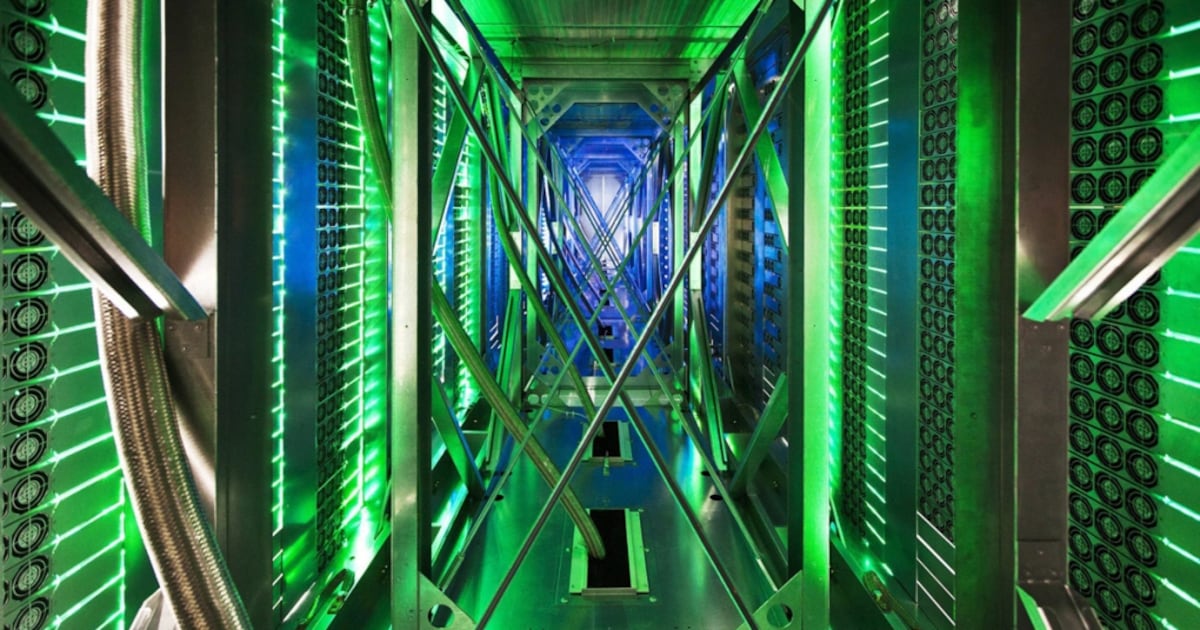
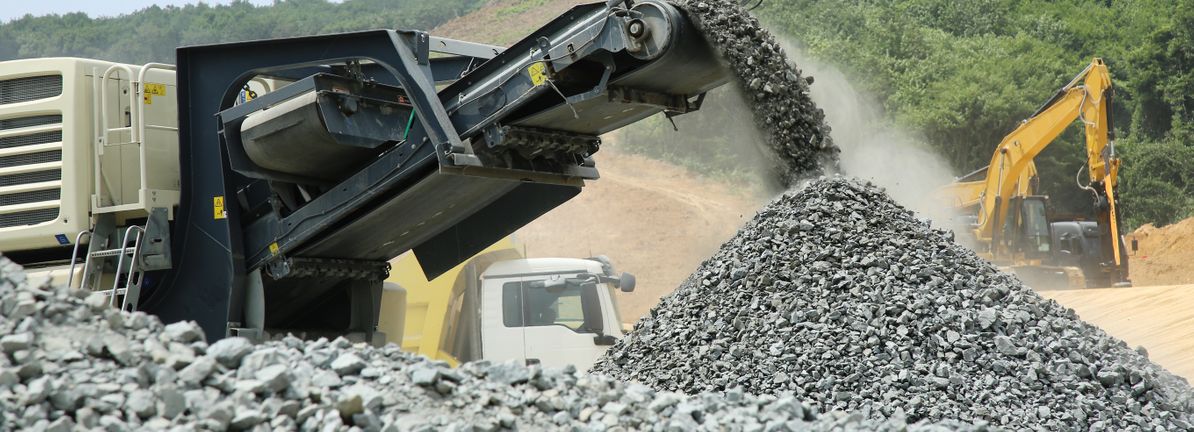
On the demand side, AI data centers represent the most compelling source of incremental copper demand. AI training and inference place far higher demands on computing power, power supply, and heat dissipation than traditional data centers. Large-scale AI data centers require vast amounts of transformers, switchgears, busbars, cables, UPS, power distribution units, and cooling systems—all of which rely heavily on copper.
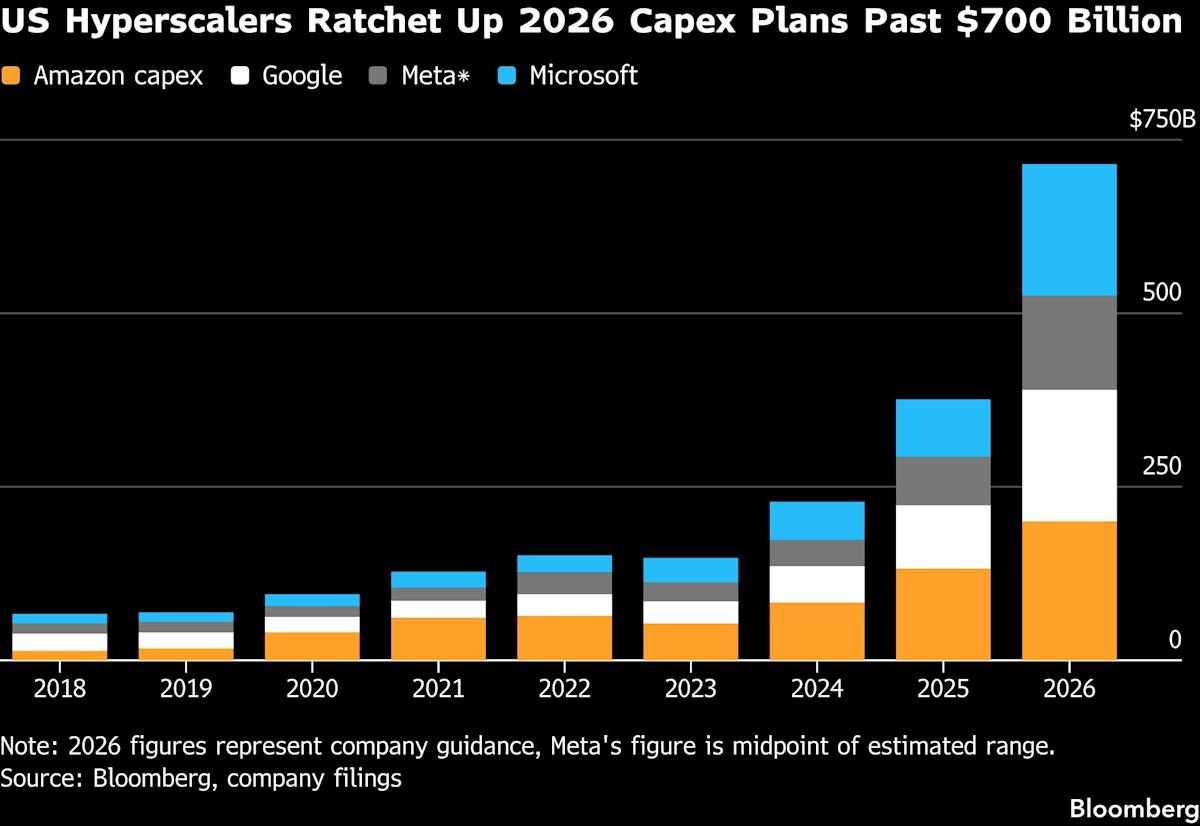
According to Wall Streetcn, a 1-gigawatt (GW) AI factory requires 50,000 metric tons of copper. Based on current industry projections of building 15 GW of capacity annually, data centers alone will add 750,000 metric tons of new copper demand each year. More importantly, AI data centers will further drive grid expansion, substation construction, and transmission and distribution line upgrades. This “external power infrastructure” could drive copper demand even more than the copper used inside the data centers themselves.
According to the IEA, global data center electricity consumption is projected to rise to approximately 945 TWh by 2030, roughly doubling current levels. Goldman Sachs also noted that the share of peak summer power demand from US data centers could rise from 4.1% in 2025 to 8.5% in 2027. This indicates that AI data centers are transitioning from marginal power loads into a critical variable shaping grid planning. As long as data centers continue to expand, investment in grid connections, transformers, transmission lines, and distribution equipment must keep pace, creating highly inelastic demand for copper in these segments.
In terms of the scale of copper demand, institutional forecasts are continuously being revised upward. S&P Global expects global copper demand to rise from 28 million metric tons per year in 2025 to 42 million metric tons per year in 2040, an increase of about 50%. Within this, copper demand from data centers is projected to grow from 1.1 million metric tons in 2025 to 2.5 million metric tons in 2040. BHP’s outlook emphasizes long-term trends, projecting that global data center copper usage will rise from around 500,000 metric tons per year today to approximately 3 million metric tons per year by 2050. Trafigura also believes that AI and data center-related demand could add an extra 1 million metric tons of copper demand by 2030. For a global copper market with an annual demand of roughly 20 million to 30 million metric tons, an incremental demand of this scale is enough to significantly alter the supply-demand balance.
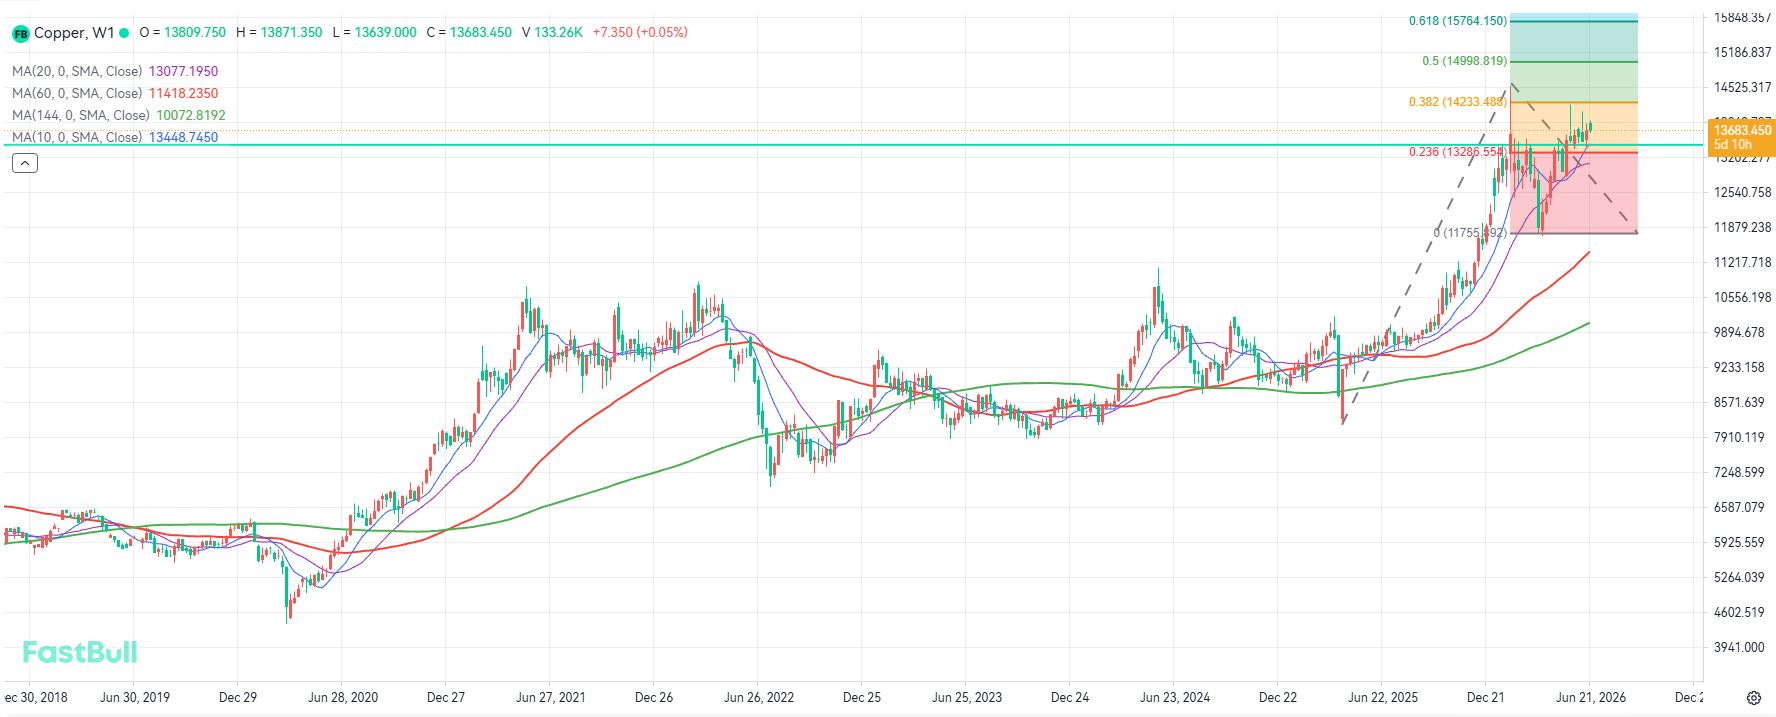
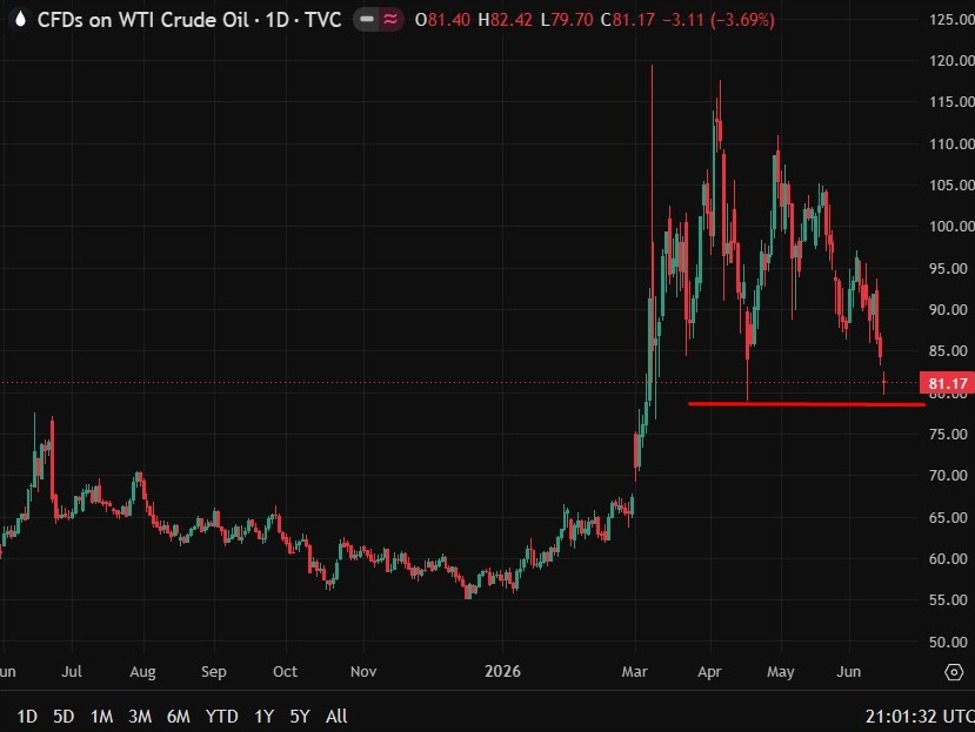
Weekly Copper Price Chart, Source: FASTBULL
On the weekly copper price chart, as the highs and lows of the candlestick chart gradually shift upward, it indicates that the overall trend maintains a strong upward momentum. Meanwhile, multiple moving averages in the moving average system maintain a bullish alignment, further confirming that the medium-to-long-term trend for copper prices remains bullish.
Currently, the primary target for copper’s upside is to test the Fibonacci 0.382 extension level of $14,233. If it can break through strongly and hold above this level, further upside room will be unlocked, with the potential to test the Fibonacci 0.5 extension level of $15,000.
Downside support should be noted at 13,400-13,300.
This content was translated using AI and reviewed for clarity. It is for informational purposes only.