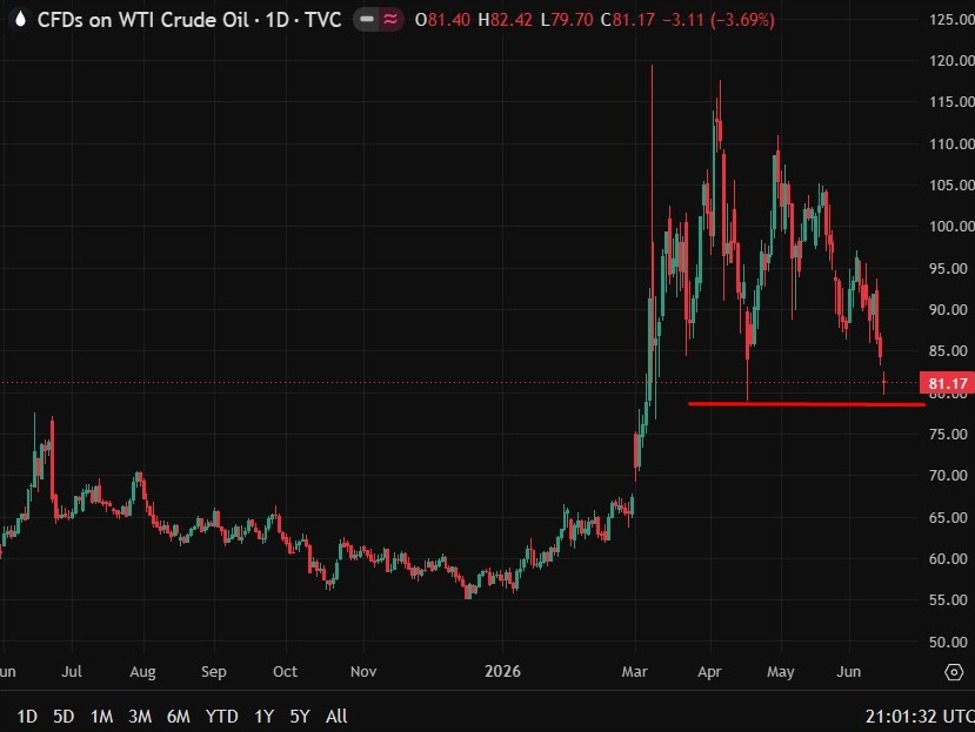
On June 12, 2026, the financial markets experienced notable shifts as Brent crude oil prices showed a slight recovery, leading to a reduction in the bullish steepening trend of German bonds. Amid ongoing tensions between the US and Iran, the European Central Bank’s anticipated interest rate increase has influenced risk assets positively. In this context, we turn our attention to Super Micro Computer Inc SMCI, a key player in the technology sector.
- GF Value™ verdict: $85.15 vs Current Price $30.01 = 64.8% undervalued
- GF Score™: 84/100, indicating strong overall performance
- Key financial signal: P/E (TTM) of 15.88x compared to a 5-year median P/E of 19.41x
What’s Behind the News?
The recent fluctuations in Brent crude oil prices and the subsequent impact on bond markets highlight the interconnectedness of global financial systems. The European Central Bank’s expected interest rate hike of 36 basis points by year-end, down from an earlier estimate of 42 basis points, reflects a cautious approach amid geopolitical tensions. This environment has led to a surge in risk assets, with Italian bonds outperforming their Eurozone counterparts for two consecutive days.
Super Micro Computer Inc operates in the technology sector, specifically within the hardware industry. With a market capitalization of approximately $18.05 billion, the company specializes in high-performance server technology services tailored for cloud computing, data centers, and high-performance computing. Its diverse range of solutions includes servers, storage systems, and networking devices, catering to a global clientele, with more than half of its revenue generated in the United States.
Is SMCI Overvalued or Undervalued?
According to GuruFocus, Super Micro Computer Inc has a GF Value™ of $85.15, indicating that the stock is currently trading at a significant discount with a 64.8% margin of safety compared to its intrinsic value. This suggests that investors may have an opportunity to acquire the stock at a favorable price. Furthermore, the company’s P/E (TTM) ratio stands at 15.88x, which is notably lower than its 5-year median P/E of 19.41x, reinforcing the notion that the stock may be undervalued. For more detailed insights, visit the GF Value™ page.
What Does SMCI’s GF Score™ Tell Us?
The GF Score™ ranks stocks from 0 to 100 based on five key aspects: Financial Strength, Profitability, Growth, Valuation, and Momentum. Stocks with higher GF Score™ values have been found to generate higher long-term returns (backtested 2006-2021).
| Metric | Rating |
|---|---|
| GF Score™ | 84 |
| Financial Strength | 6/10 |
| Profitability | 8/10 |
| Growth | 10/10 |
| Valuation | 2/10 |
| Momentum | 7/10 |
Super Micro Computer Inc’s strengths lie in its impressive growth rank of 10/10 and a profitability rank of 8/10, indicating robust operational performance. However, its valuation rank of 2/10 suggests that while the stock may be undervalued, investors should exercise caution due to potential risks associated with valuation. For further details, visit the SMCI stock page.

What Are Insiders Doing with SMCI Stock?
In the past three months, there have been no reported insider buying or selling activities for Super Micro Computer Inc, indicating a potential wait-and-see approach from insiders regarding the stock’s future performance.
What This Means for Investors
Based on the available data, Super Micro Computer Inc appears to be significantly undervalued with a GF Value™ of $85.15 compared to its current trading price of $30.01. However, potential investors should consider the company’s valuation rank and the lack of insider activity before making any decisions. For the complete analysis, visit the SMCI stock page. You can also use the GuruFocus Stock Screener to find similar opportunities.
Frequently Asked Questions
What is SMCI’s GF Score™?
SMCI’s GF Score™ is 84/100, indicating strong overall performance across various financial metrics.
Is SMCI overvalued or undervalued?
SMCI is currently undervalued, with a GF Value™ of $85.15 compared to its current price of $30.01, representing a 64.8% discount.
What is SMCI’s P/E ratio compared to historical?
SMCI’s P/E (TTM) ratio is 15.88x, which is significantly lower than its 5-year median P/E of 19.41x, suggesting potential undervaluation.
This stock alert was generated using automated technology and GuruFocus financial data to provide readers with timely and accurate market reporting. This content was reviewed by GuruFocus editorial team prior to publication. Please send any questions or comments about this story to [email protected].