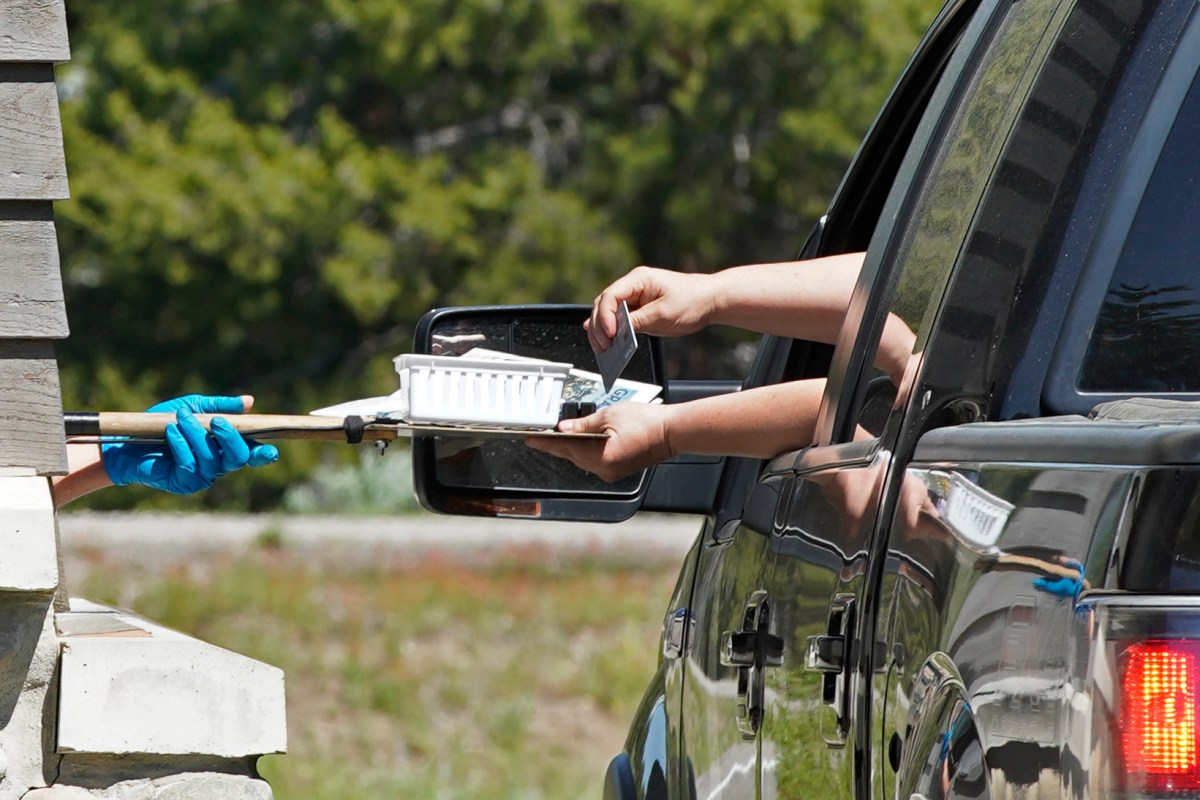
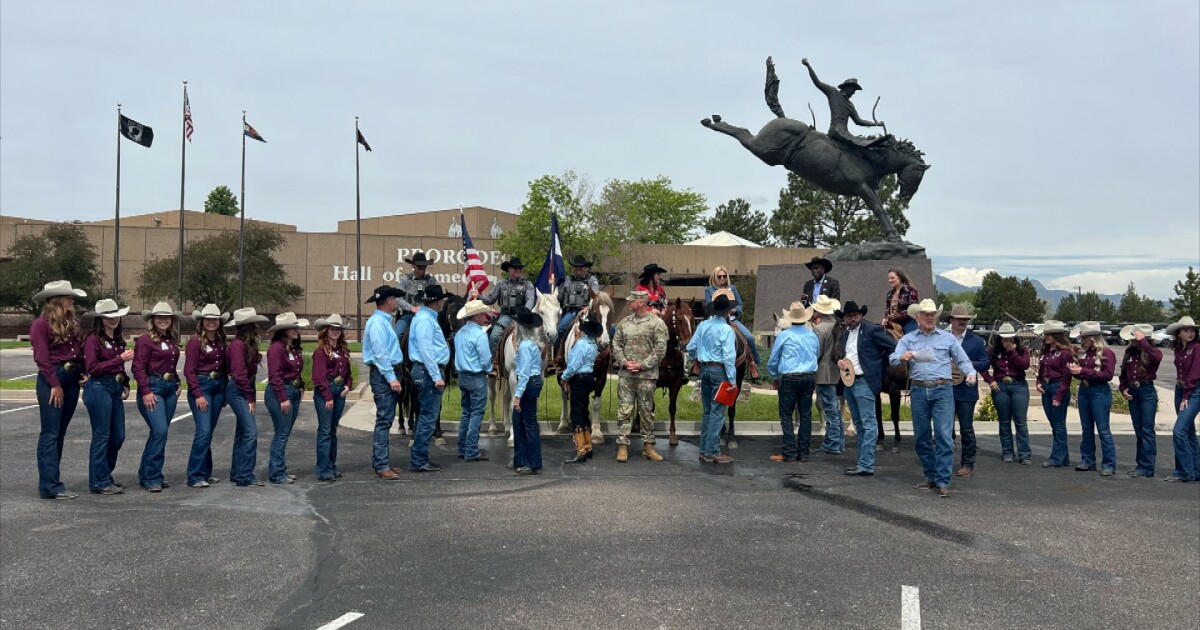
Bitcoin futures are mildly bearish short term, while Ether futures are showing a cleaner bearish structure. At the time of writing, Nasdaq futures are down around 1.2% from yesterday’s close, roughly 1 hour and 45 minutes before the US stock premarket opens. That is not a small move for this stage of the session, and it adds weight to the idea that markets may be shifting into a post-event “sell the news” or risk-off phase after the Trump-Xi meeting/event.

As the highly anticipated Xi-Trump meeting concludes, we are seeing classic “sell the news” positioning begin to materialize in the cryptocurrency space, fueled by broader macro anxieties as a risk-off wave starts to sweep across markets ahead of European trading. This jittery sentiment is being amplified by resurfacing geopolitical tensions, highlighted by the fact that South Korean stocks reverse record highs as Trump patience on Iran wears thin, prompting speculative capital to quickly rotate out of high-beta assets. However, while short-term profit-taking is evident, a major bearish macro reversal is far from confirmed; underlying market mechanics are still being heavily supported by adjacent tech liquidity narratives, particularly the Bitcoin, Cerebras IPO mania, and the SpaceX speculation angle traders are watching, which suggests buyers may simply be retreating to moving averages like the 200-day to wait for a safer entry point before resuming the structural trend.

Key takeaways for Crypto Traders on 15 May, 2026:

  • BTC futures score: -3 / +10 – mildly bearish short term, but the daily structure is not fully broken.
  • ETH futures score: -5 / +10 – bearish short term and weaker than BTC.
  • Relative strength: BTC > ETH – Bitcoin is holding up better than Ether.
  • Macro backdrop: Nasdaq futures weakness increases the risk that crypto follows broader risk assets lower.
  • Best relative expression: Long BTC / Short ETH, if BTC continues to hold better and ETH keeps lagging.

BTC and ETH bias scores at investingLive.com on 15 May 2026

What is the crypto futures outlook today?

The combined read is defensive. Bitcoin futures are under short-term seller control after failing to extend yesterday’s bullish repair, while Ether futures are showing a weaker and more decisive downside pattern.

The important macro overlay is Nasdaq futures. A move of around -1.2% from yesterday’s close before the US premarket opens suggests risk appetite is fading early. If this weakness continues into the cash session, it may pressure crypto as well, especially the weaker parts of the market.

This is where the Trump-Xi event risk matters. Markets often rally into a major event on hope, positioning, and liquidity. Once the event is behind the market, traders may reduce exposure, take profit, or fade the move if there is no fresh catalyst strong enough to extend the rally.

That does not mean crypto must collapse. But it does mean that the burden of proof is now on buyers.

Bitcoin futures analysis today: Mildly bearish, but not broken

BTC futures score: -3 / +10

Bitcoin is weaker short term, but not fully broken on the daily structure.

The May 14 daily bar showed a meaningful bullish repair, with stronger buyer response and higher value acceptance. However, the current May 15 bar is not confirming that impulse so far. Price is digesting lower, sell volume is above buy volume, and the short-term value area has slipped.

Key BTC futures levels

BTC futures level Why it matters
82,250 Upper daily value area and stronger bullish continuation level
81,700-81,750 Main repair zone bulls need to reclaim
81,100-81,250 Current transition area
80,965-80,900 First intraday support
80,540 Immediate bearish breakdown line
79,750-79,700 Next meaningful lower support
78,500-78,900 Broader daily repair support

The short-term bearish case strengthens if BTC stays below 81,100-81,700 and then loses 80,540. That would suggest sellers are not only rejecting the prior repair area, but also forcing a lower-value acceptance phase.

For bullish repair, BTC needs to reclaim 81,700-81,750 with stronger buying participation. Without that reclaim, rebounds should be treated cautiously.

Ether futures analysis today: Cleaner bearish structure than BTC

ETH futures score: -5 / +10

Ether is the weaker crypto futures market right now.

ETH did not show the same clean daily repair that Bitcoin showed. While BTC printed a stronger bullish daily response on May 14, ETH had higher volume but still could not produce clean positive buyer control. That matters because rising activity without bullish acceptance can point to supply still being active.

ETH is also trading below important short-term and daily reference areas. The latest intraday breakdown moved into the 2,248.5 area, with lower value acceptance and a wider downside range.

Key ETH futures levels

ETH futures level Why it matters
2,330-2,334 Daily repair and upper reference area
2,310-2,308 Failed repair zone
2,300-2,292 4h transition area
2,282-2,275 Current short-term resistance zone
2,266-2,270 Broken intraday value area
2,248.5 Immediate pressure level
2,240.5 Current breakdown low
2,236-2,240 Downside support zone
2,227 Lower daily support reference

The bearish ETH case remains active while price stays below 2,266-2,270. A stronger breakdown would be confirmed if ETH accepts below 2,240.5.

For repair, ETH first needs to reclaim 2,275-2,282. A stronger invalidation of the bearish read would require a move back above 2,300-2,310.

Bitcoin Futures Test Key Resistance: Bear Flag Risk or Short Trap Setup?

Bitcoin spot daily chart with SMA200 and regression channel

My simple chart above shows Bitcoin spot price sitting at a major decision point. It is one of those areas where several important technical forces meet at the same price zone: trend structure, statistical resistance, and trader psychology.

In simple terms, the market is testing a level where both bulls and bears have a strong reason to act.

1. Normal channel vs. regression channel

There is an important difference between a regular price channel and a linear regression channel.

A normal channel is drawn manually. A trader connects a few swing lows, projects a parallel line across the swing highs, and uses that as support and resistance. It can be useful, but it is also subjective. Two traders can draw it slightly differently.

A linear regression channel is more statistical. It calculates the “best-fit” trend line through price over a specific period, then adds upper and lower bands based on how far price usually moves away from that average path.

Why does this matter?

Because a regression channel helps show when price is stretched relative to its recent trend. When price reaches the upper band, it is not automatically bearish, but it does mean price is statistically expensive for that window. That is where some traders and algorithms start looking for mean reversion, profit-taking, or short setups.

2. The bear flag risk

Even though price has been grinding higher inside the blue channel, the bigger structure still carries risk.

The sharp drop on the left side of the chart into February can be viewed as the “flagpole.” The slow upward channel that followed can be viewed as the “flag.”

That is why some traders may see this as a potential bear flag.

A bear flag often happens after a strong selloff, when price slowly drifts higher but does not show enough strong buying to fully reverse the prior damage. In that case, the move higher may only be a corrective bounce before sellers try to take control again.

The important trigger would be a daily close below the lower side of the regression channel. If that happens, the bear flag thesis becomes much more serious, and traders may start looking for a larger downside move.

3. The bullish “handle” scenario and the short trap

But the bearish case is not guaranteed.

Markets are fluid. Just because price gets rejected at resistance does not mean the entire recovery is finished.

If bulls can absorb the selling pressure without losing the lower regression band, price may start moving sideways below the 200-day simple moving average. That kind of sideways digestion can create a “handle” structure, similar to a cup-and-handle or volatility contraction setup.

This is where the short trap can develop.

If price chops sideways long enough, the 200-day moving average can flatten or move closer to price. That makes the breakout level easier to attack. Then, if price suddenly breaks above both the upper regression band and the 200-day SMA, the bear flag thesis gets invalidated.

At that point, traders who shorted the resistance zone may be forced to cover. Their stop-loss orders become buy orders, and that can fuel a fast move higher.

In crypto, this kind of setup can move quickly because positioning often becomes crowded around obvious technical levels.

4. Why selling here makes sense

For now, the rejection near $81,932 is not surprising. It does not necessarily mean the asset is fundamentally weak. It simply means price reached an area where many market participants are expected to sell.

There are several reasons for that:

The upper band of the linear regression channel is acting as statistical resistance.

The 200-day SMA is a major trend reference watched by traders, funds, and algorithms.

Traders who bought near the February lows may be taking profits.

Short sellers may see this as a clean risk-reward area to defend.

So the current selling pressure is logical. The real question is what happens next.

If selling pressure leads to a break below the lower regression channel, the bear flag scenario gains strength.

But if price absorbs the selling, holds the structure, and later breaks above the 200-day SMA, the setup can flip from bearish rejection to bullish breakout fuel.

For crypto traders, this is the key point: the level itself is not the full signal. The reaction after the test is what matters most.

BTC vs ETH: Which crypto futures market is stronger?

Bitcoin is stronger than Ether right now.

Instrument Daily read 4h read 30 min read Composite score
BTC futures Mildly weak Bearish Bearish -3 / +10
ETH futures Bearish Bearish More bearish -5 / +10

The difference is not extreme, but it is meaningful. BTC still has some daily repair structure behind it. ETH has a weaker daily sequence, weaker short-term value migration, and a sharper intraday breakdown.

That makes ETH the cleaner short-against candidate if risk-off sentiment continues.

Trade scenario: Long BTC / Short ETH

The most logical relative-value idea is:

Long BTC / Short ETH

Pair score: 6.5 / 10

This is not a pure bullish Bitcoin call. It is a relative strength expression. The idea is that BTC may hold up better if crypto remains under pressure, while ETH may remain the weaker leg.

The pair idea works best if:

  • BTC avoids a decisive loss of 80,540
  • ETH remains below 2,266-2,270
  • Nasdaq futures weakness continues to pressure risk assets
  • ETH fails to reclaim 2,275-2,282
  • BTC continues to show better relative stability than ETH

If BTC also breaks down aggressively, the pair becomes less attractive because both legs may move lower together. In that case, a direct ETH short may be cleaner than a relative BTC/ETH expression.

What would confirm bearish continuation?

For BTC futures, bearish continuation strengthens if price stays below 81,100-81,700 and breaks below 80,540.

For ETH futures, bearish continuation strengthens if price stays below 2,266-2,270 and breaks below 2,240.5.

The broader risk-off read strengthens if Nasdaq futures remain weak into the US premarket and early cash session. Crypto traders should watch whether equities stabilize or whether the early decline turns into a broader de-risking move.

What would invalidate the bearish crypto read?

The bearish read would weaken if Bitcoin reclaims 81,700-81,750 and Ether reclaims 2,275-2,282.

A stronger bullish repair would require ETH to recover 2,300-2,310, while BTC would need to push back above the repaired daily value area near 82,250.

Until then, the market remains tilted toward short-term caution.

Today’s summary for Bitcoin and Ether futures traders

Bitcoin futures are mildly bearish at -3 / +10, but the daily structure is not fully broken. Ether futures are weaker at -5 / +10, with a cleaner bearish short-term setup and more damaged intraday structure.

The key macro risk is that Nasdaq futures are already down around 1.2% before the US premarket opens. That supports the possibility of a broader risk-off move after the Trump-Xi event is behind the market.

For directional shorts, ETH currently looks cleaner than BTC. For relative-value traders, BTC is the stronger leg and ETH is the weaker leg. The practical map is simple: BTC needs to hold above 80,540, while ETH needs to recover 2,275-2,282 to reduce downside pressure. Until those conditions change, caution remains justified.

Always do your own research and trade crypto futures at your own risk only. The above is for educational purposes only.


Source link

Leave a Reply

Your email address will not be published. Required fields are marked *