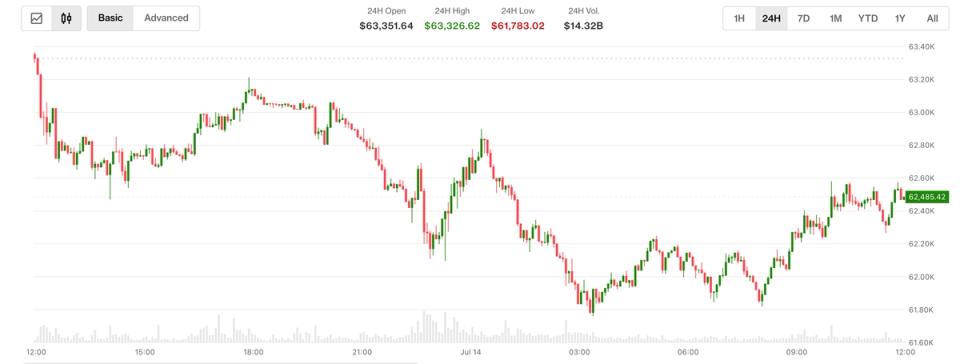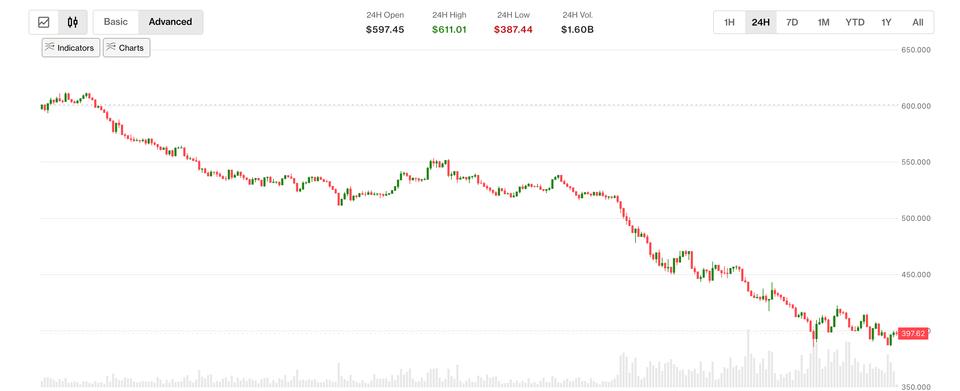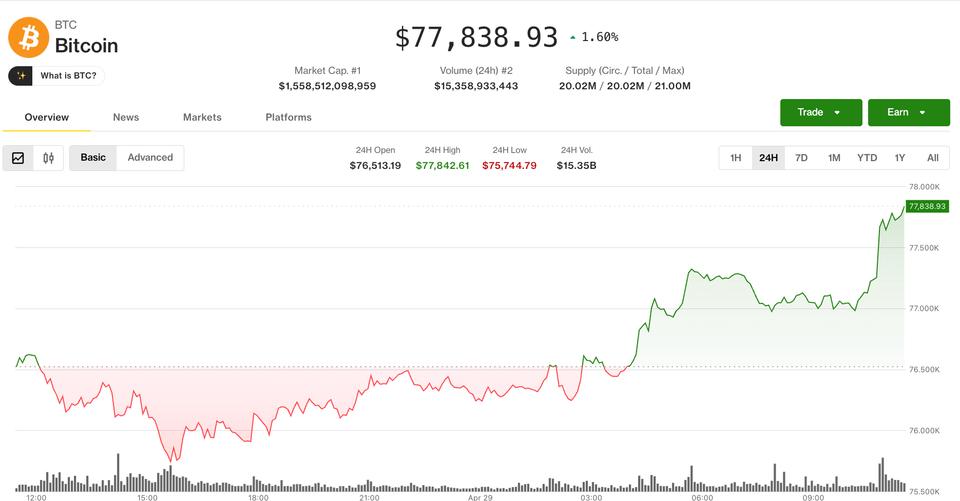
- Bitcoin has reclaimed the $76000 handle and maintains a firmly bullish technical structure.
- The $75000 psychological level is acting as a consistent pivot, suggesting sustained institutional interest.
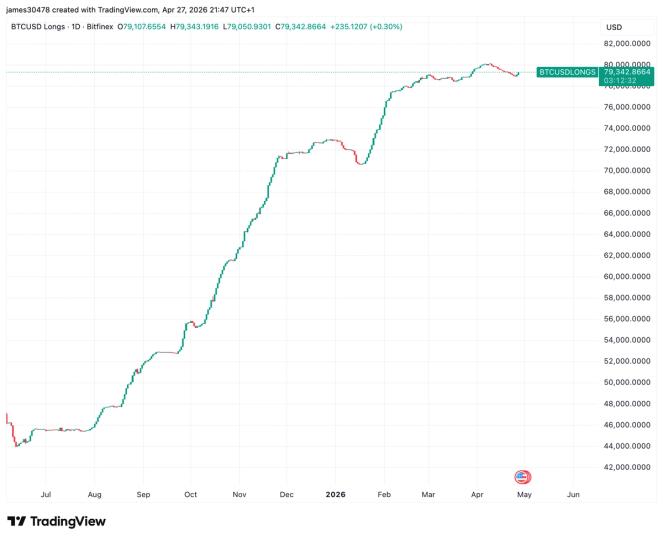
- If buying pressure persists, the primary short-term goal is a run toward the psychological $80000 level, with the ultimate bullish hurdle being $82133.
Bitcoin (BTC/USD) has displayed impressive resilience during the Monday session, shaking off early-morning sluggishness to reclaim the $76000 handle. After a brief period of consolidation, the premier cryptocurrency looks poised to challenge its recent highs, underpinned by a technical structure that continues to favor the “buy the dip” crowd.
Daily Chart: Holding the MA High Ground
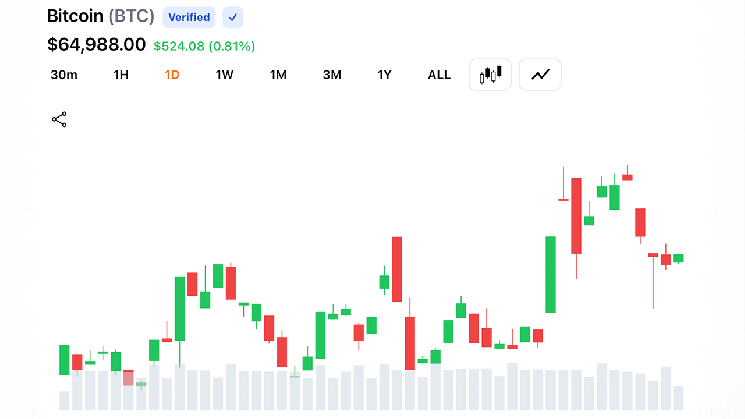
The daily timeframe remains the cornerstone of the current bullish thesis. Following the impulsive “V-shaped” recovery throughout early April, Bitcoin has successfully turned previous resistance into rock-solid support.
Key observations on the Daily:
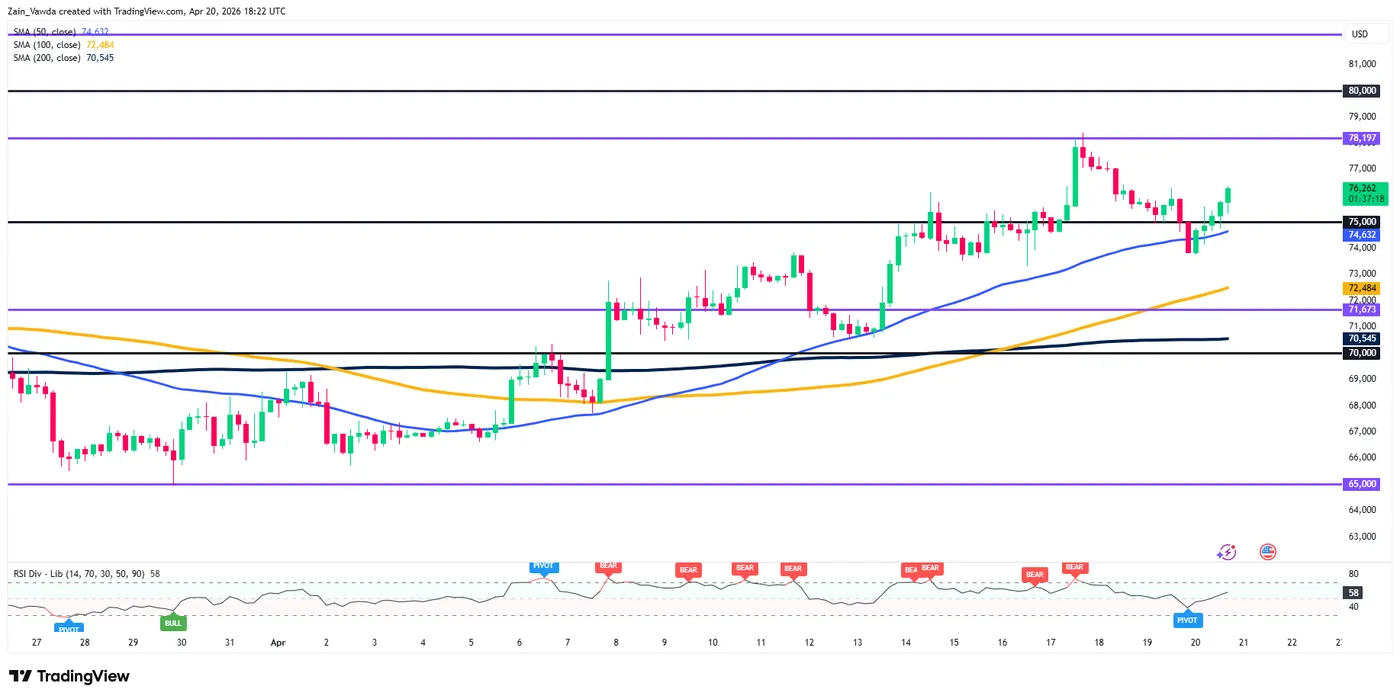
- The SMA Support Sandwich: Bitcoin is currently trading comfortably above its 100-day MA (yellow) at $74145 and its 50-day MA (blue) at $70577.
As long as the pair remains above this “support sandwich,” the broader bias remains firmly bullish.
- The $75000 Pivot: The daily candles are showing a consistent ability to close above the $75000 psychological level, suggesting that institutional interest is picking up at these elevated levels.
- RSI Momentum: The Daily RSI is trending at 61, indicating that while momentum is positive, we are still a long way from the “danger zone” of 70+, leaving significant room for a run toward the $82133 hurdle.
Bitcoin (BTC/USD) Daily Chart, April 20, 2026
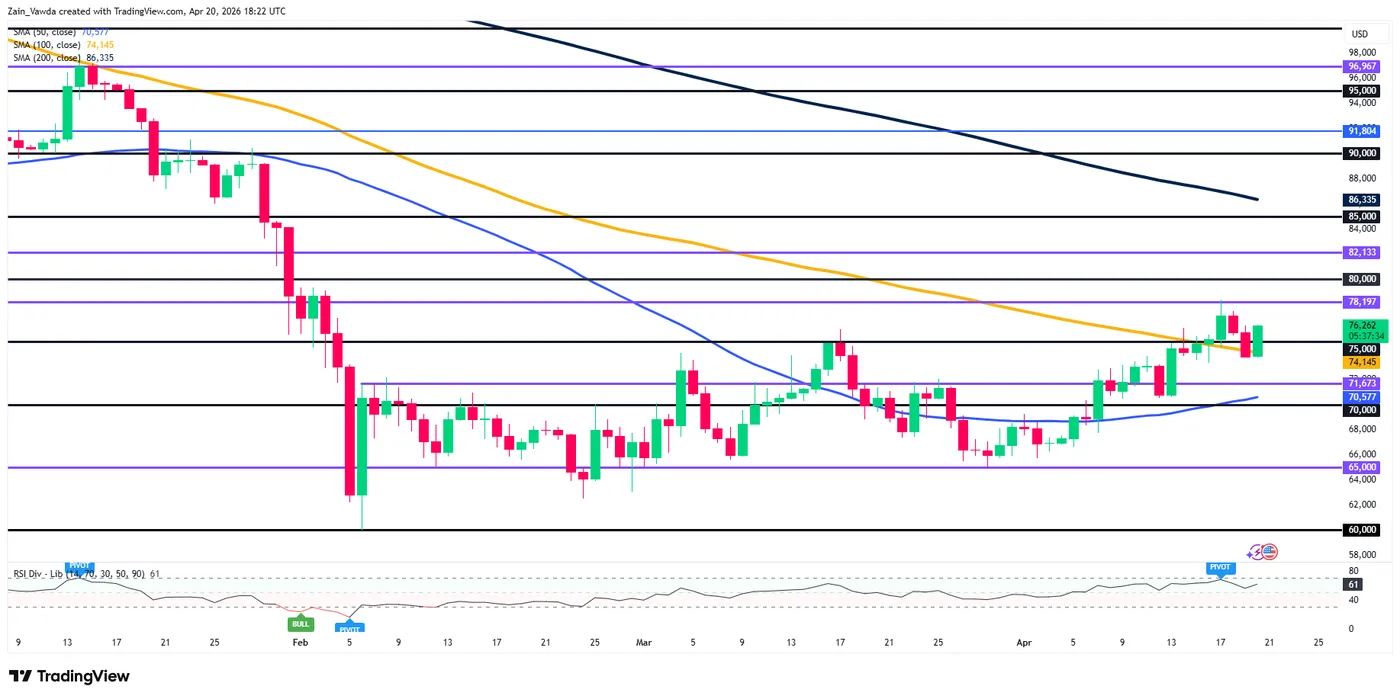
Source: TradingView.com (click to enlarge)
H4 Chart: The Bullish Base at $74000
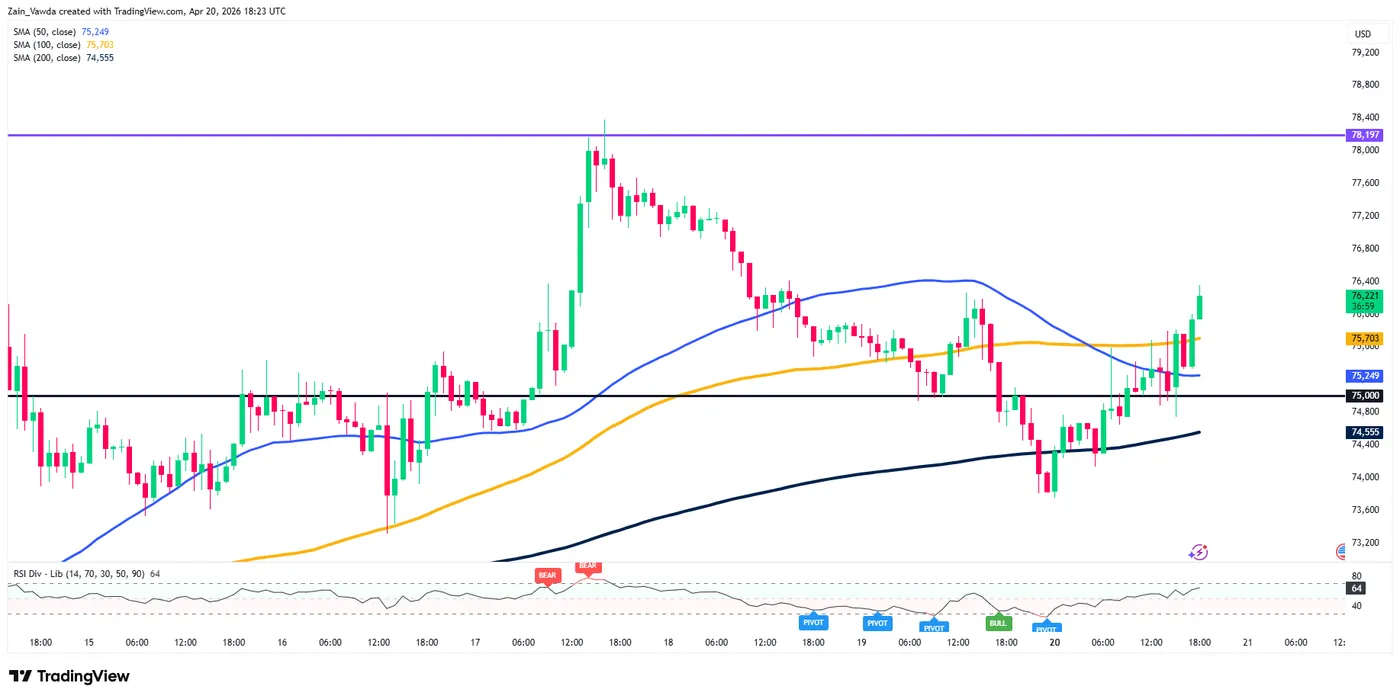
Zooming into the H4 chart, we can see a textbook example of healthy trend development. After hitting a local top near $78197, the pair underwent an orderly retracement that found a floor exactly at the 50-period MA (blue), currently at $74632.
The H4 structure has now printed a significant higher low. With the RSI bouncing off its midpoint (58) after a “PIVOT” low signal, the indicators suggest that the corrective phase is over, and the next impulsive leg may be beginning to take shape.
Bitcoin (BTC/USD) Four-Hour Chart, April 20, 2026
Source: TradingView.com (click to enlarge)
H1 Chart: Session Scenarios & Intraday Outlook
The hourly chart provides the most immediate optimism, with Bitcoin slicing back above its 50, 100, and 200-period MAs in a single concerted move.
The Bullish Scenario
For the bulls to maintain this momentum into the Asian and European sessions, we need to see a sustained hold above the $75700 area (the H1 100-MA). A clean break above $76800 would likely trigger a liquidation of short positions, clearing the path for a retest of $78197. If buying pressure persists, a psychological run toward $80000 becomes the primary target.
The Bearish Scenario
The bears need a rejection at current levels and a break back below the $75000 pivot to regain any short-term control. Failure to hold the $74555 level (H1 200-MA) would signal a more prolonged consolidation, likely drawing the price back toward the structural support at $71673.
However, given the current “BULL” labels on the RSI, the bears seem to be on the back foot for now.
Key Levels to Watch:
- Resistance: $78197, $80000, $82133
- Support: $75000, $74145 (Daily 100-MA), $71673
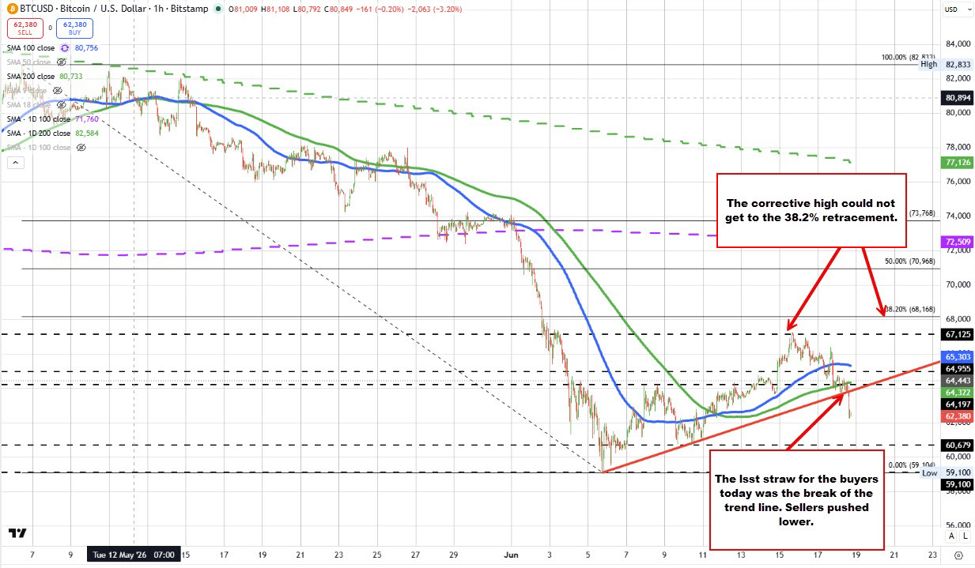
Bitcoin (BTC/USD) One-Hour Chart, April 20, 2026
Source: TradingView.com (click to enlarge)
Bitcoin is effectively “re-loading” for its next major move. The confluence of support between $74,000 and $75,000 has proven to be a formidable base for the bulls. WIll it serve as a base for Bitcoin to finally push beyond the coveted $80000 mark?