Most existing sector-rotation visualizations on TradingView normalize each sector independently against its own historical range. That approach has a fundamental flaw — when one sector reads “80” and another reads “70,” those numbers are not comparable to each other, because each one is relative to its own past, not to the other sectors. You cannot rank sectors that way.
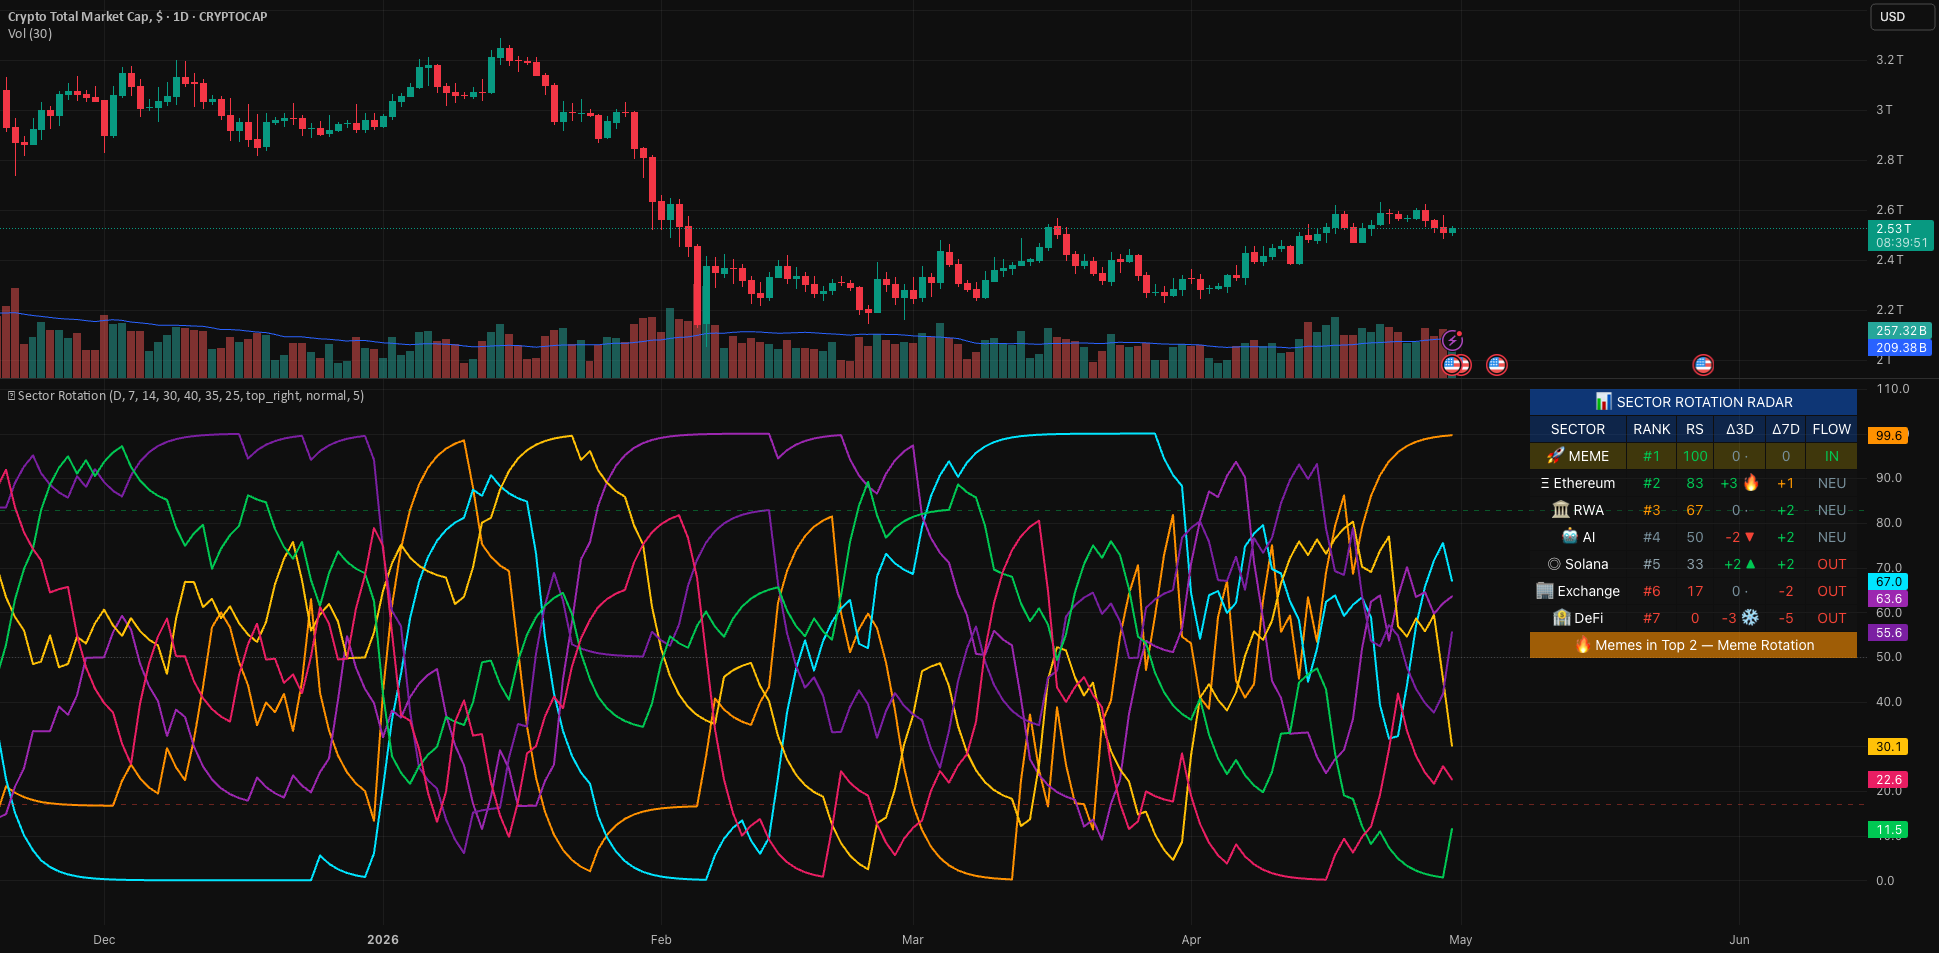
This script does it differently. Every sector’s momentum is measured against the same benchmark — TOTAL crypto market cap — so the resulting scores are directly comparable. Then sectors are ranked #1 through #7 in real time. The output is a single dashboard table that tells you, at a glance, which sectors are leading, which are lagging, and which are accelerating or fading.
▸ WHAT IT DOES
For each of 7 crypto sectors, the script:
1. Computes the sector-cap-to-TOTAL ratio
2. Measures rate-of-change of that ratio across three windows (default: 7, 14, 30 bars)
3. Blends the three windows by user-configurable weights into a single raw RS reading
4. Cross-sectionally ranks all 7 sectors against each other (#1 strongest, #7 weakest)
5. Converts rank to a 0–100 RS Score (rank 1 → 100, rank 4 → 50, rank 7 → 0)
6. Tracks rank change over 3 and 7 bars to surface acceleration and rotation
7. Classifies each sector’s flow as IN, OUT, or NEU based on rank and momentum
All of this is rendered in a sortable dashboard table, with optional smoothed RS lines plotted below for historical pattern context.
▸ SECTORS TRACKED
• 🚀 Memecoins (CRYPTOCAP:MEME.C)
• Ξ Ethereum Eco (CRYPTOCAP:ETHEREUM.C)
• 🏛 RWA (CRYPTOCAP:RWA.C)
• 🤖 AI (CRYPTOCAP:AI.C)
• ◎ Solana Eco (CRYPTOCAP:SOLANA.C)
• 🏢 Exchange Tokens (CRYPTOCAP:EXCHANGES.C)
• 🏦 DeFi (CRYPTOCAP:TOTALDEFI)
The benchmark for all RS calculations is CRYPTOCAP:TOTAL.
▸ HOW TO READ THE TABLE
Each row shows one sector with six columns:
• SECTOR — emoji and name
• RANK — current cross-sectional rank (#1 = strongest, #7 = weakest)
• RS — 0–100 score derived from rank
• Δ3D — rank change over the last 3 bars, with a heat badge (🔥 ▲ ↗ · ↘ ▼ ❄️)
• Δ7D — rank change over the last 7 bars
• FLOW — IN (top 3 + positive momentum), OUT (bottom 3 + negative momentum), NEU (mixed)
A footer row summarizes the regime in plain language:
• 🔥 Memes in Top 2 — Meme Rotation
• ⚠️ Risk-Off Regime — defensive sectors leading while risk-on lagging
• ❄️ Memes in Bottom 2 — sector weak
• Mixed Rotation — no clear leader pattern
The memecoin row is highlighted by default to make it stand out at a glance for memecoin-focused traders. This can be toggled off in settings.
▸ HOW TO READ THE LINES
Below the table, each sector’s RS Score is plotted as a smoothed line using EMA smoothing (default: 5 bars). Because the raw RS Score takes only 7 discrete values (rank-derived), a small amount of smoothing turns step-function jumps into readable curves while preserving the cross-sectional comparability.
• Lines above 83 = sector is currently in top 2 by RS
• Lines below 17 = sector is currently in bottom 2 by RS
• Lines crossing through the middle band = active rotation in or out
• Multiple lines bunched together = no clear sector leadership
Smoothing length is user-adjustable. Set to 1 for raw stepped lines.
▸ INPUT SETTINGS
Calculation:
• Calculation Timeframe — default Daily, locked regardless of chart TF
• Short / Medium / Long Window — three momentum lookbacks (default 7, 14, 30 bars)
• Three weight inputs to blend the windows (default 40 / 35 / 25 %)
Display:
• Toggle the dashboard table
• Choose table position and size
• Toggle the memecoin row highlight
• Toggle the RS score lines
• Adjust line smoothing (EMA length)
Colors — all six dashboard color states are individually configurable.
▸ BUILT-IN ALERTS
The script defines 17 alert conditions, available through TradingView’s standard Add Alert dialog:
Per-sector surges (rank improved by 2+ over 3 bars):
• 🚀 MEME surged
• Ξ Ethereum surged
• 🏛 RWA surged
• 🤖 AI surged
• ◎ Solana surged
• 🏢 Exchange surged
• 🏦 DeFi surged
Per-sector drops (rank declined by 2+ over 3 bars):
• same 7 sectors, mirrored
Memecoin-specific:
• 🔥 MEMES entered Top 2
• ❄️ MEMES dropped to Bottom 2
Regime:
• ⚠️ Risk-Off Regime — defensives leading, risk-on lagging
▸ HOW TO USE IT
The script pulls all of its data from CRYPTOCAP indices via request.security, so the chart symbol does not affect the calculation. Putting it on CRYPTOCAP:TOTAL on the Daily timeframe gives the cleanest macro context, but the radar will work identically on any chart.
Default timeframe is Daily, which is appropriate for sector-rotation analysis. Higher-timeframe rotations are typically slower-moving signals; lower timeframes will produce noisier rankings.
▸ LIMITATIONS AND HONEST CAVEATS
• This is a contextual / regime tool, not a predictive one. The radar tells you the current state of cross-sector capital flow. It does not predict which sector will lead next.
• Rank is a relative measure. A sector at rank #1 with weak absolute momentum is still rank #1 — but the broader market may be in a downtrend. Pair this with absolute price/cap context.
• When two or more sectors have very similar momentum, ranks can flip frequently. The Δ3D and Δ7D columns help filter noise from real rotation.
• Sector definitions follow TradingView’s CRYPTOCAP indices, which themselves are subject to TradingView’s classification logic. If a token is reclassified, all sectors will reflect that change.
• RS Score is derived from rank, so it can only take 7 discrete values (0, 16.7, 33.3, 50, 66.7, 83.3, 100). The smoothing on the plotted lines is purely cosmetic; the table values are exact.
▸ TECHNICAL NOTES
• Pine Script v6
• Open-source under the Mozilla Public License 2.0
• Uses 8 request.security calls (well below the 40-call limit), all to official CRYPTOCAP indices
• No repainting — all calculations use confirmed bar close values from the requested timeframe
• Designed to coexist with other indicators on the same chart
▸ DISCLAIMER
For educational and informational purposes only. This script is a market analysis tool, not financial advice. Nothing here constitutes a recommendation to buy or sell any asset. Past behavior of the radar in historical data is not a guarantee of future behavior. Cryptocurrency markets are highly volatile and can result in substantial losses. Always do your own research and trade with risk you can afford to lose.