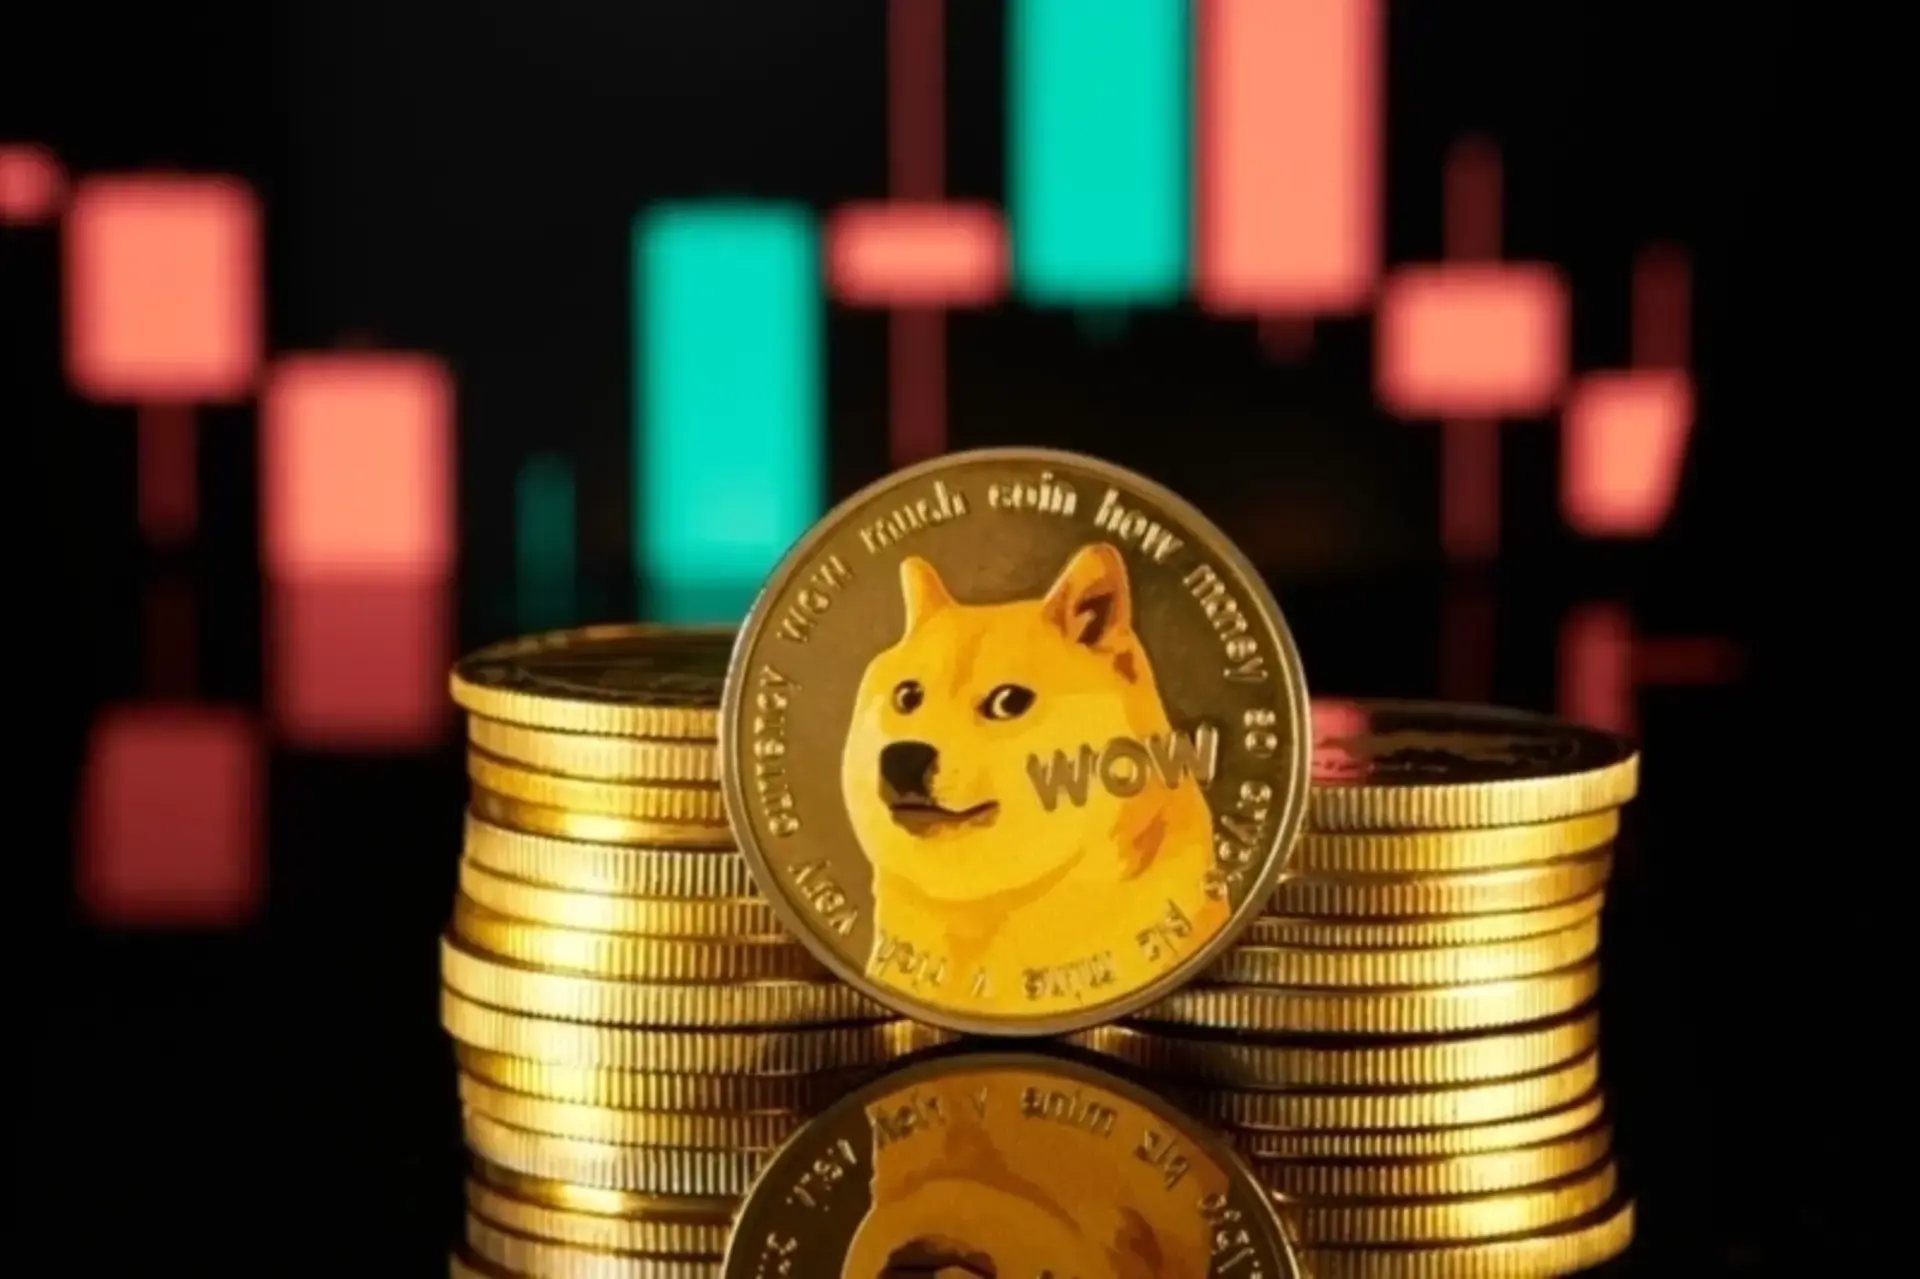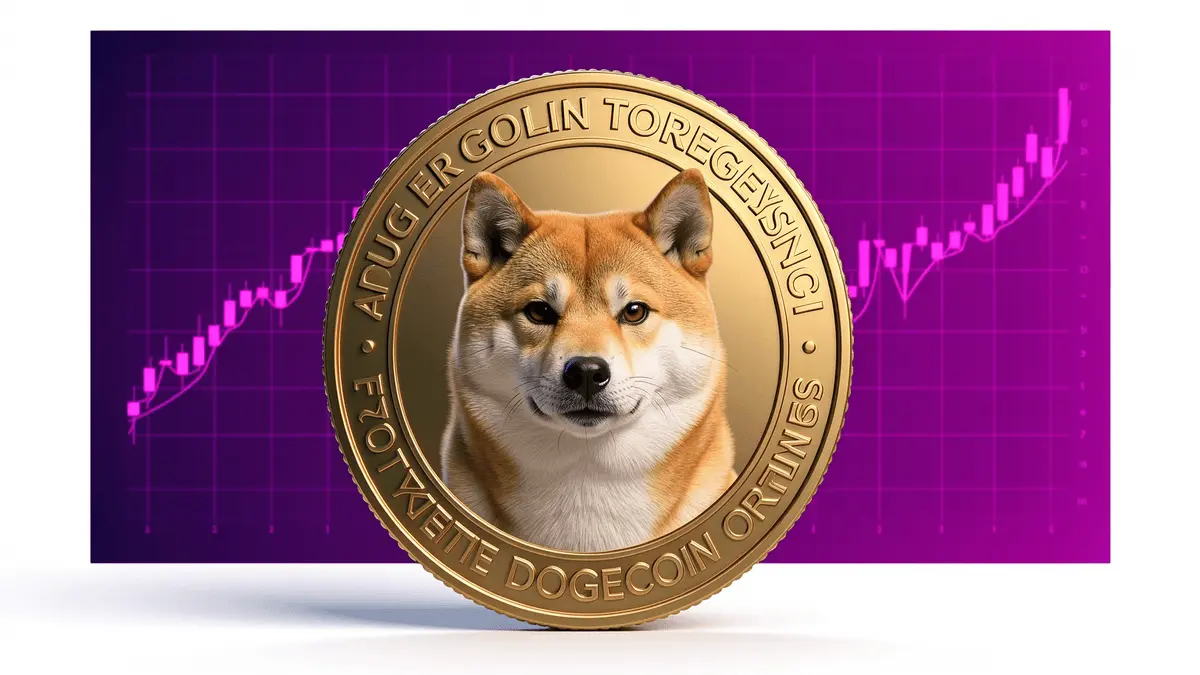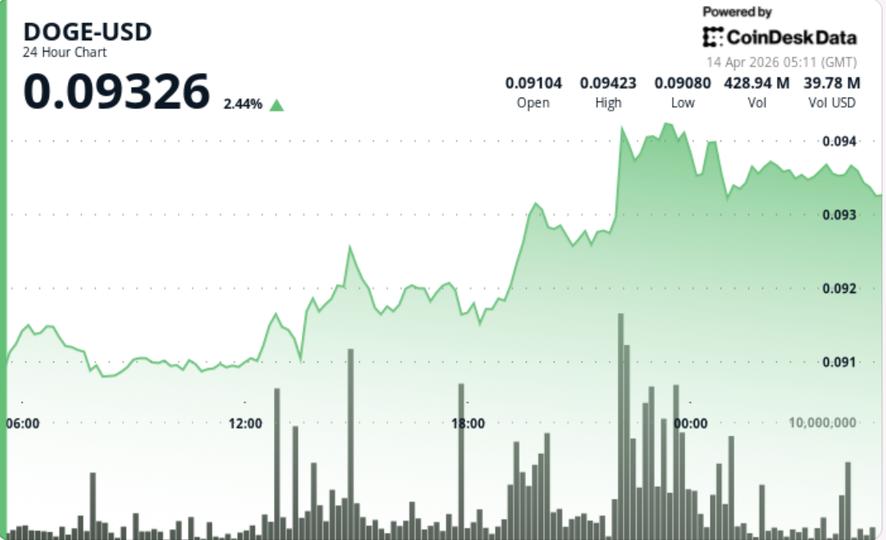
Dogecoin trades at $0.08735 on June 17, sitting on the rising channel support that has held every test since the June 5 low near $0.0779, with the FOMC rate decision landing today and the meme coin sector down 81.9% from its November 2024 peak.
$DOGE Daily Chart: Liquidity Sweep Done and Price Consolidating Between Two Clear Levels
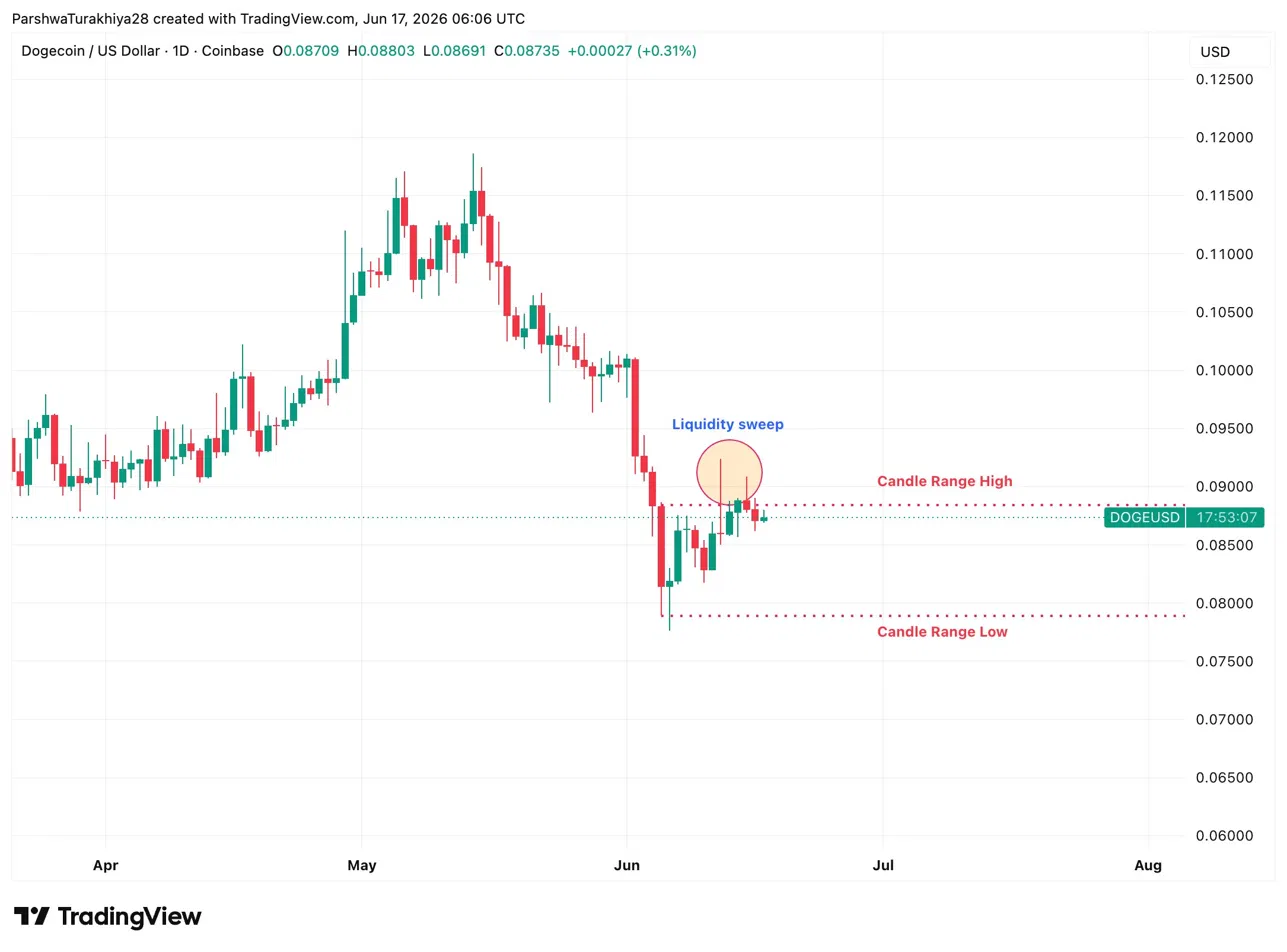
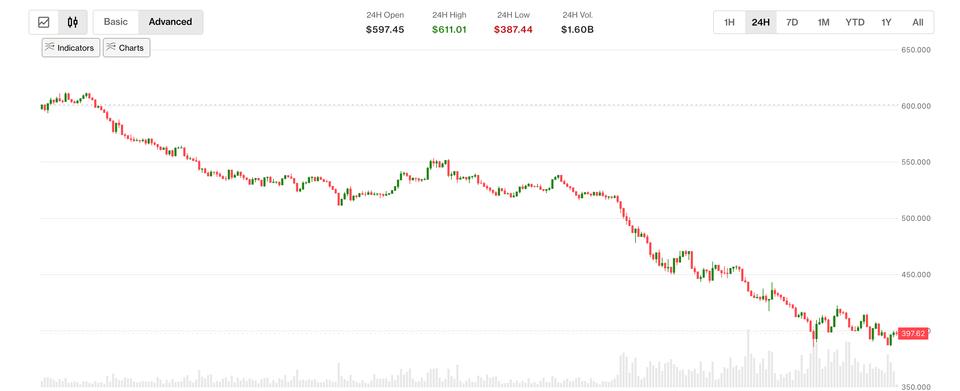
The daily chart shows a sharp liquidity sweep below $0.08 on June 5 that flushed weak hands before price recovered back into the candle range. The candle range high at $0.09 and candle range low at $0.08 now define the battle zone. $DOGE has been consolidating between these levels for over a week without a decisive break in either direction.
Related: Worldcoin (WLD) Price Prediction 2026, 2027, 2028, 2029, 2030-2050
Price needs a daily close above $0.09 to confirm the liquidity sweep was the June low. Until that happens, the setup stays in no-man’s land between two clearly defined boundaries.
- Resistance: $0.09 (candle range high), $0.0955 (pre-dump level)
- Support: $0.087 (channel support), $0.08 (candle range low)
$DOGE 2H Chart: Rising Channel Intact With Supertrend Still Bearish Overhead
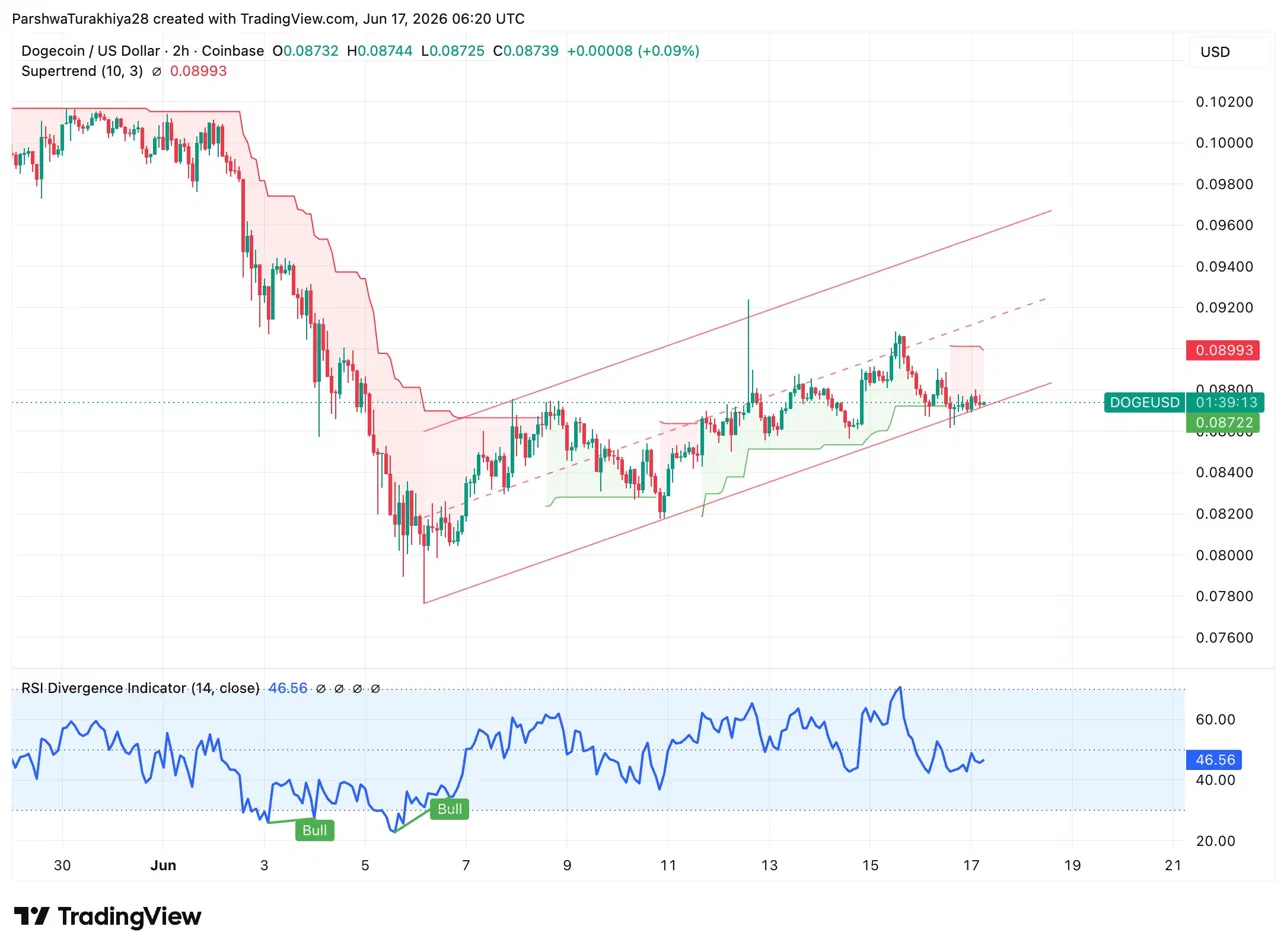
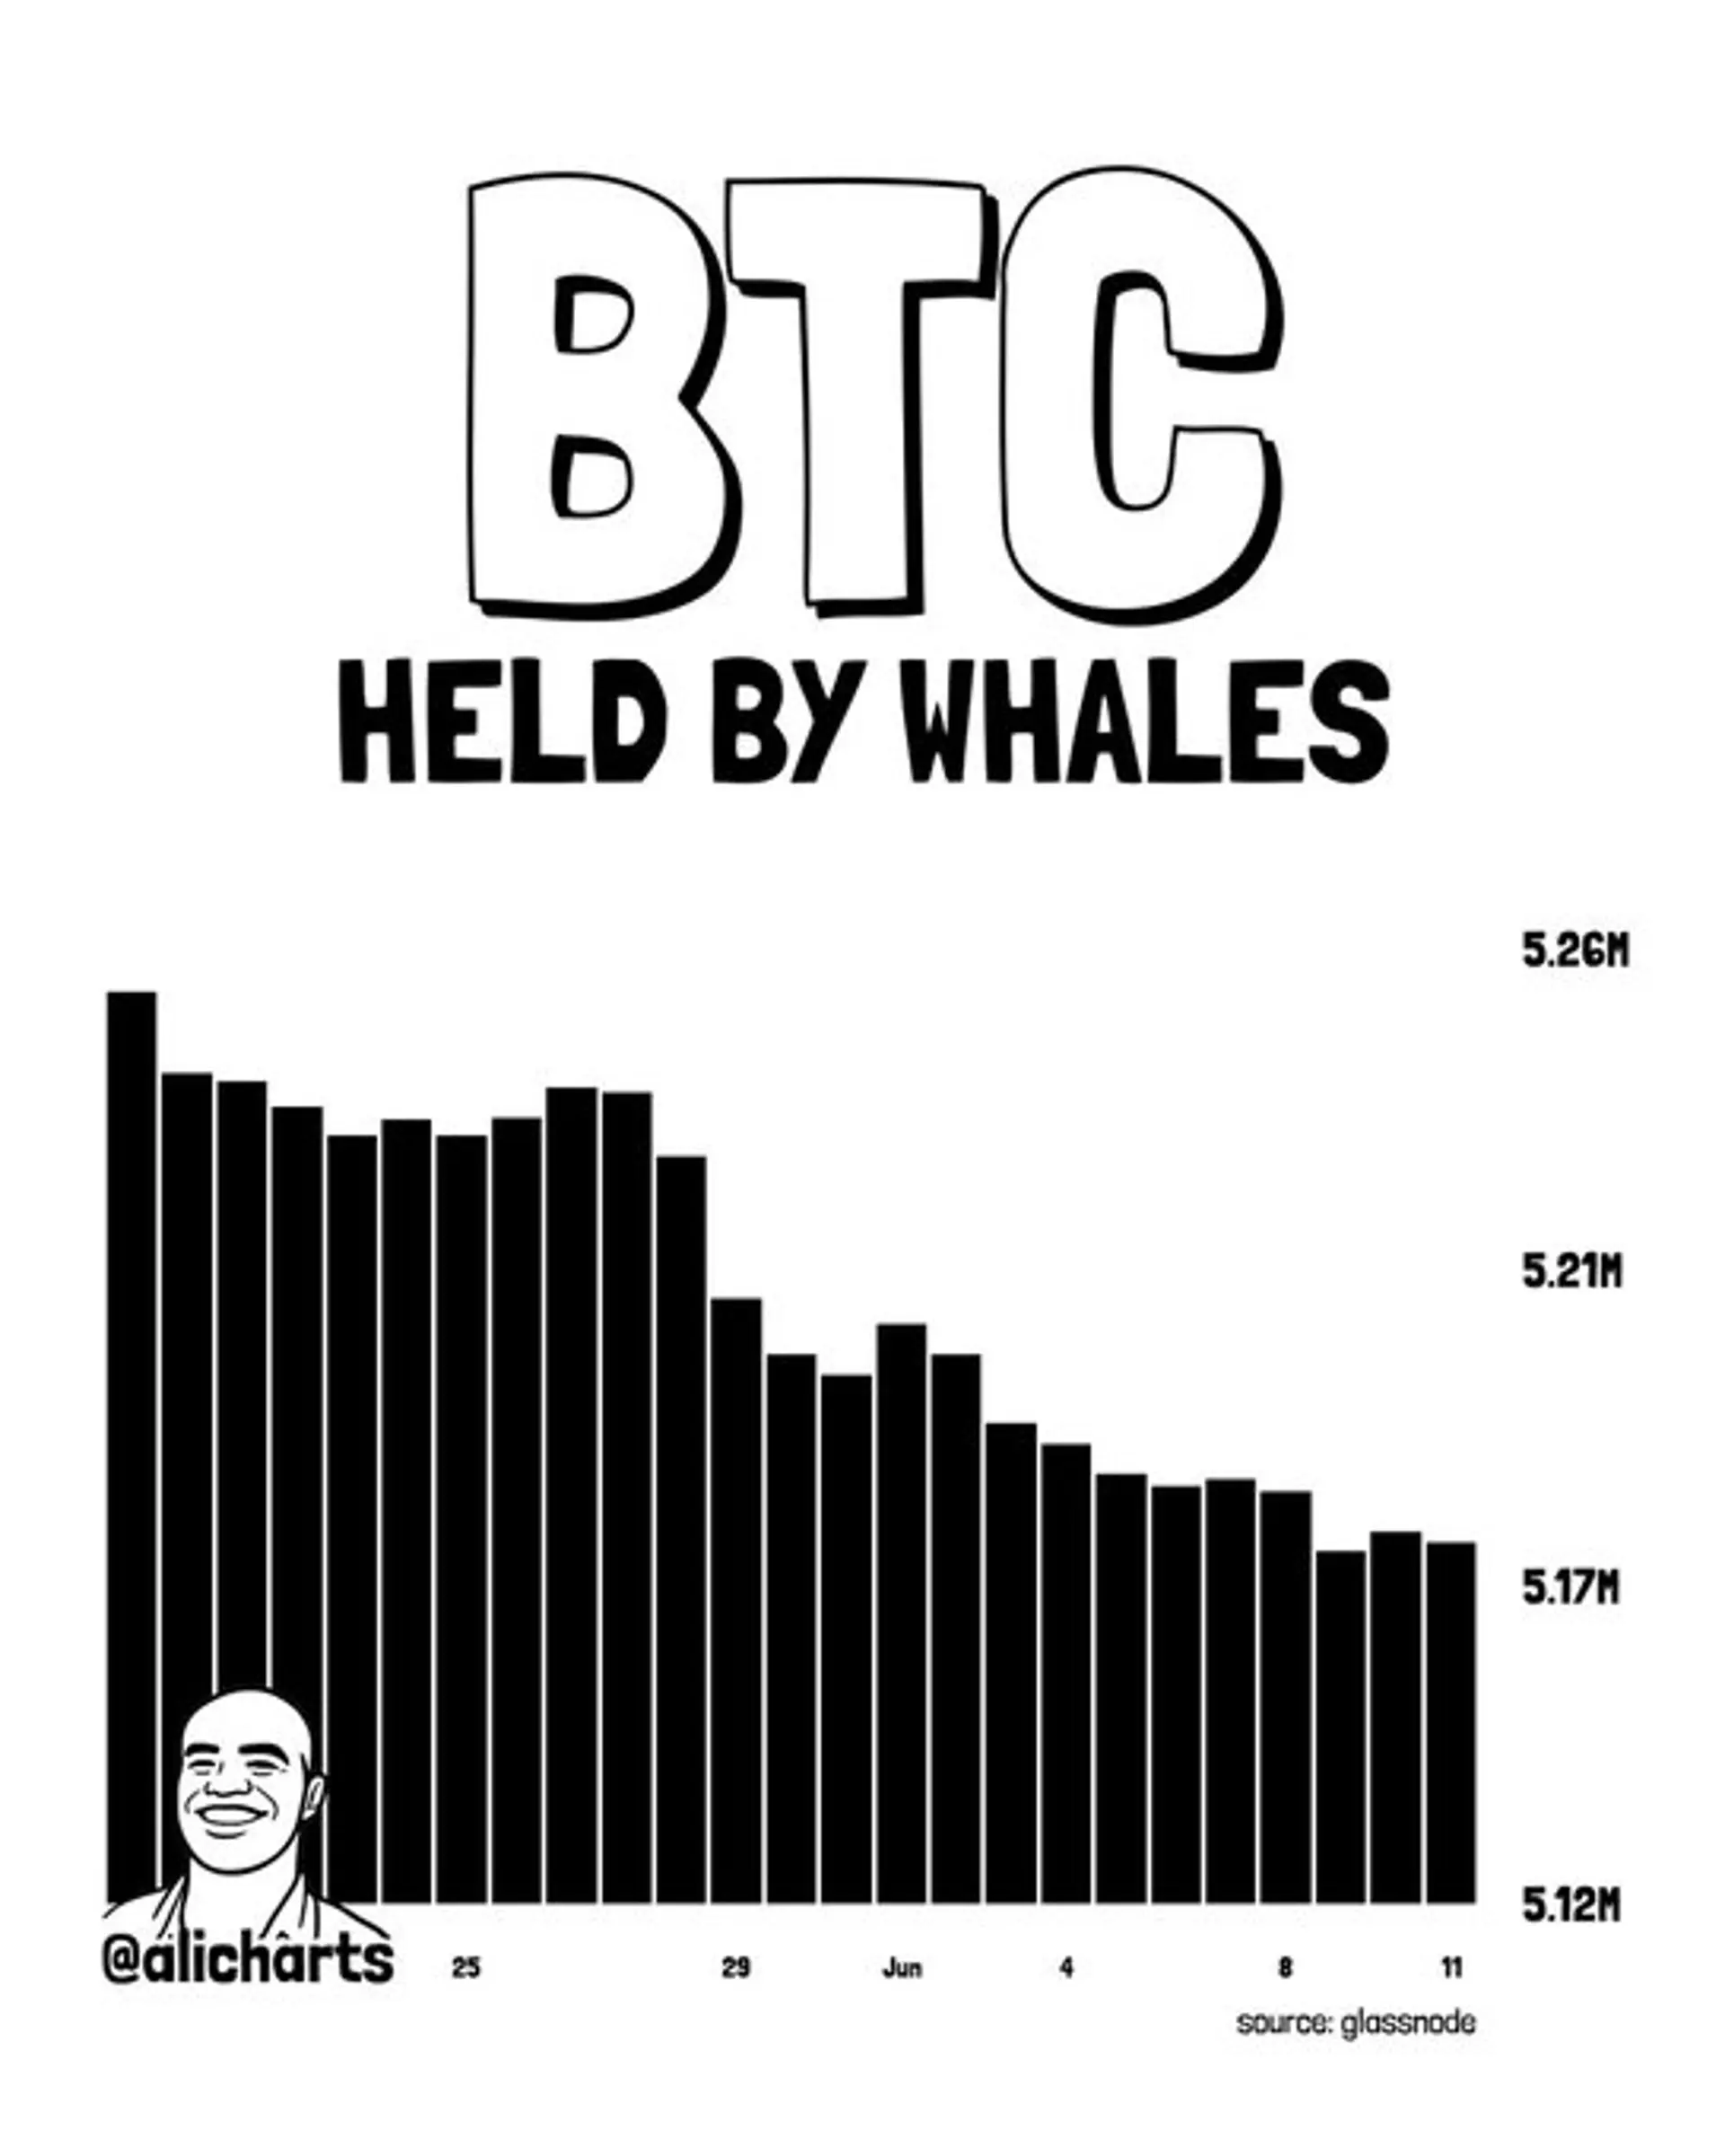
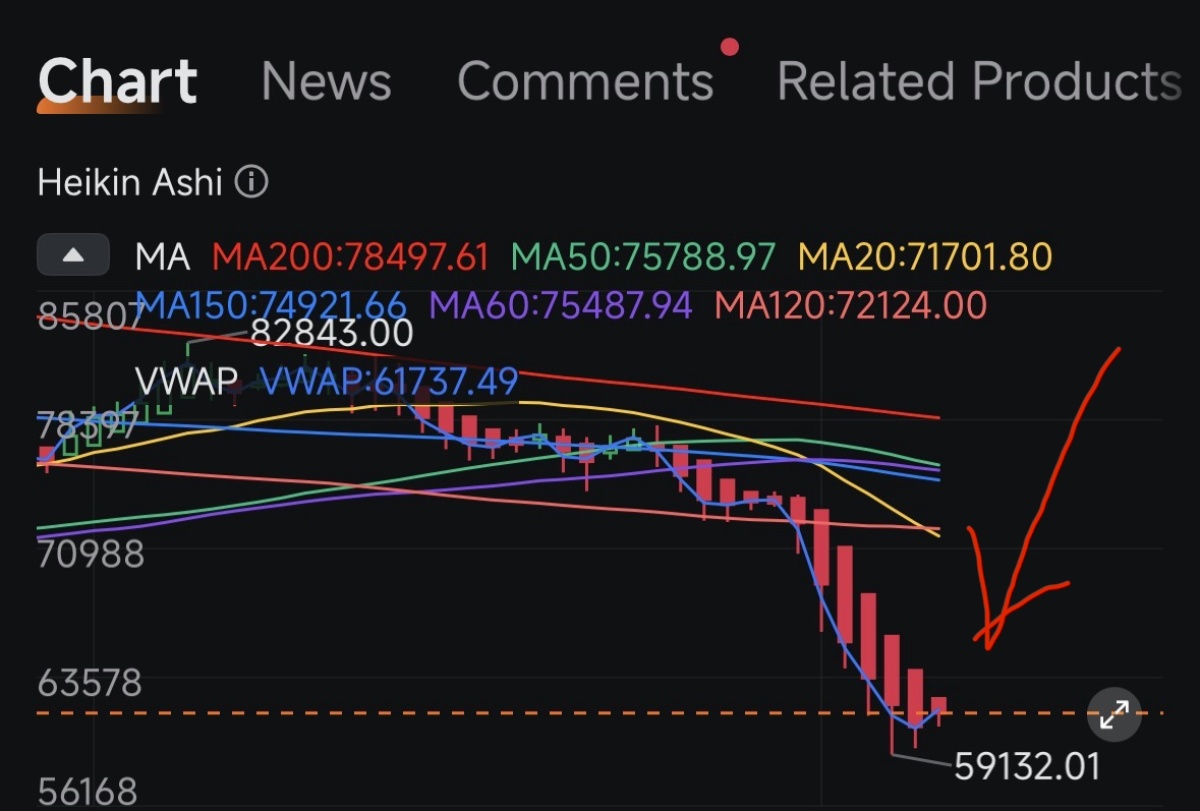
The 2H chart shows a clean rising channel from the June 5 low with price printing consistent higher lows. The channel lower boundary sits near $0.087 right now, which is exactly where Ali Charts flags the key support level. RSI at 46.56 is neutral with two prior bullish divergences between June 3 and June 7 powering the recovery from $0.0779.
The Supertrend at $0.08993 sits above price and remains bearish, capping the current recovery. A close above $0.08993 flips the short-term structure and opens the mid-range target at $0.092. The channel upper boundary near $0.096 is the bigger target if momentum builds.
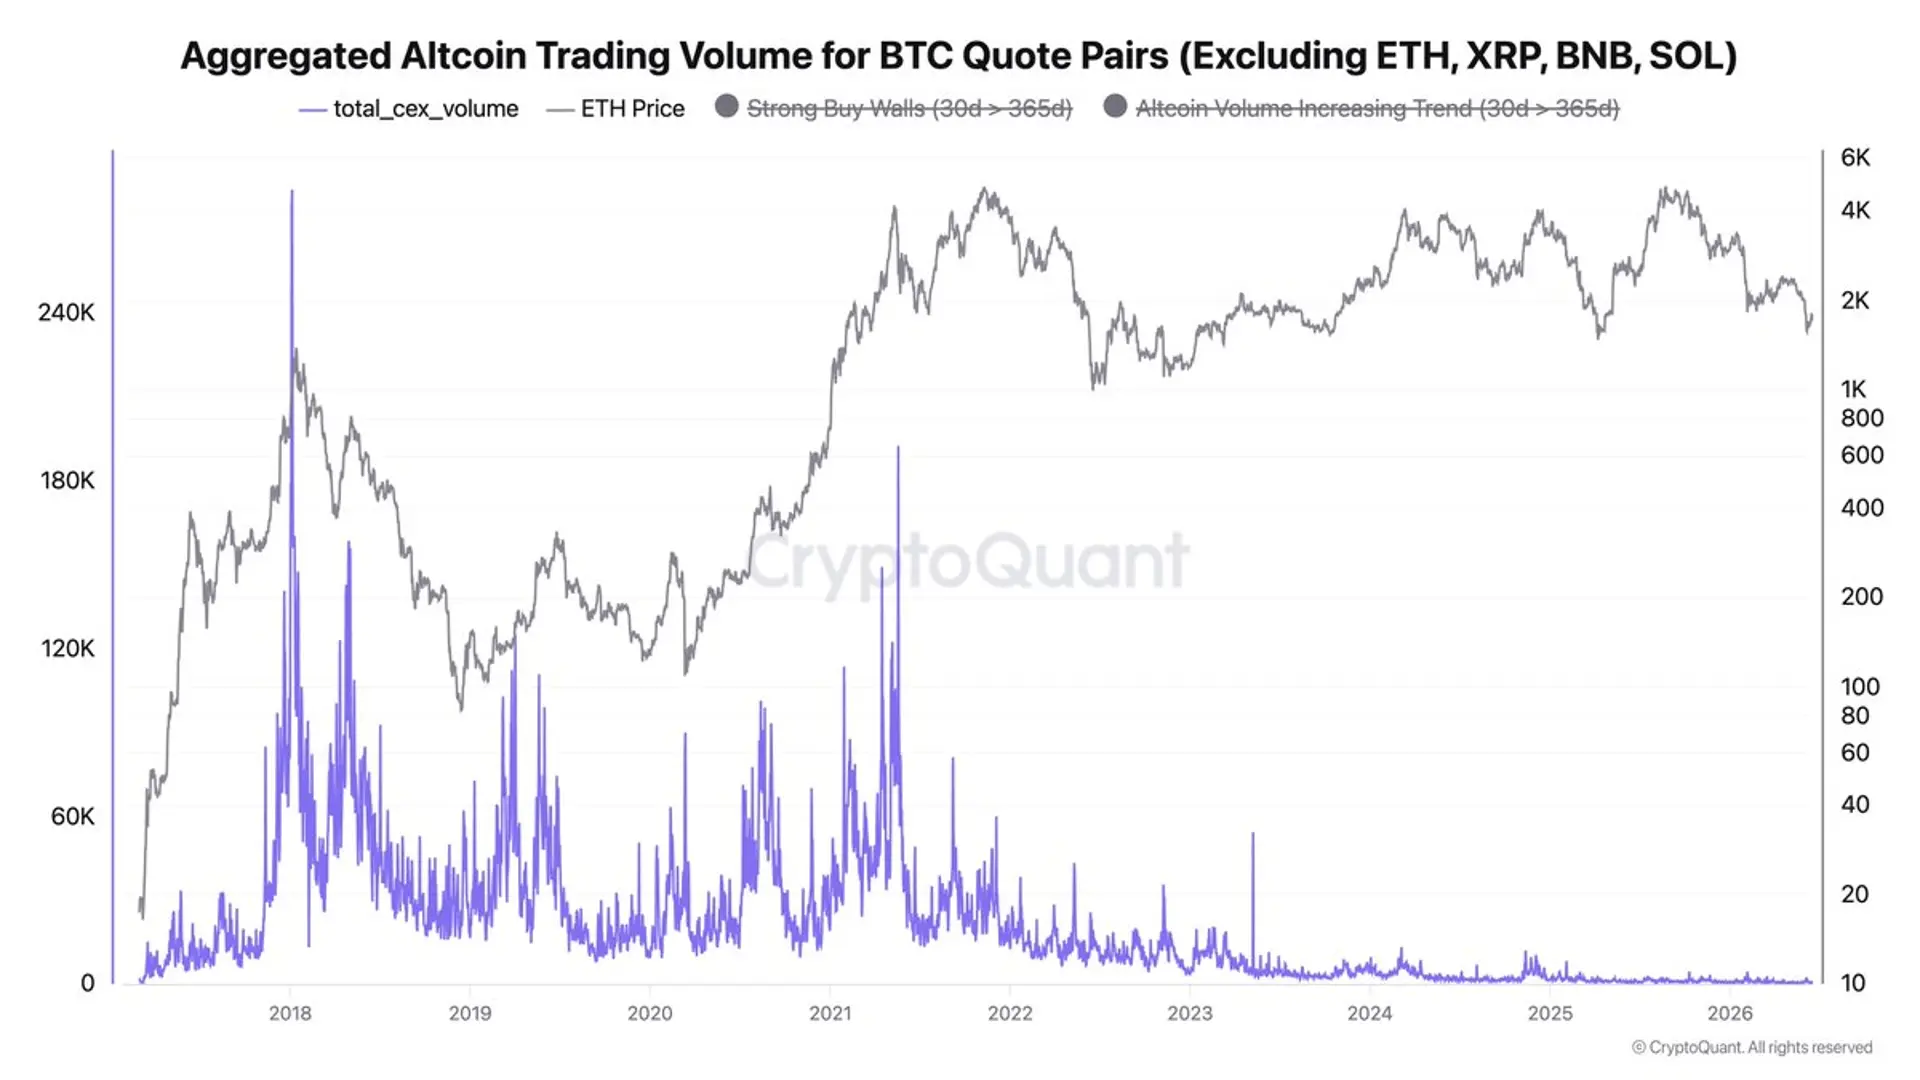
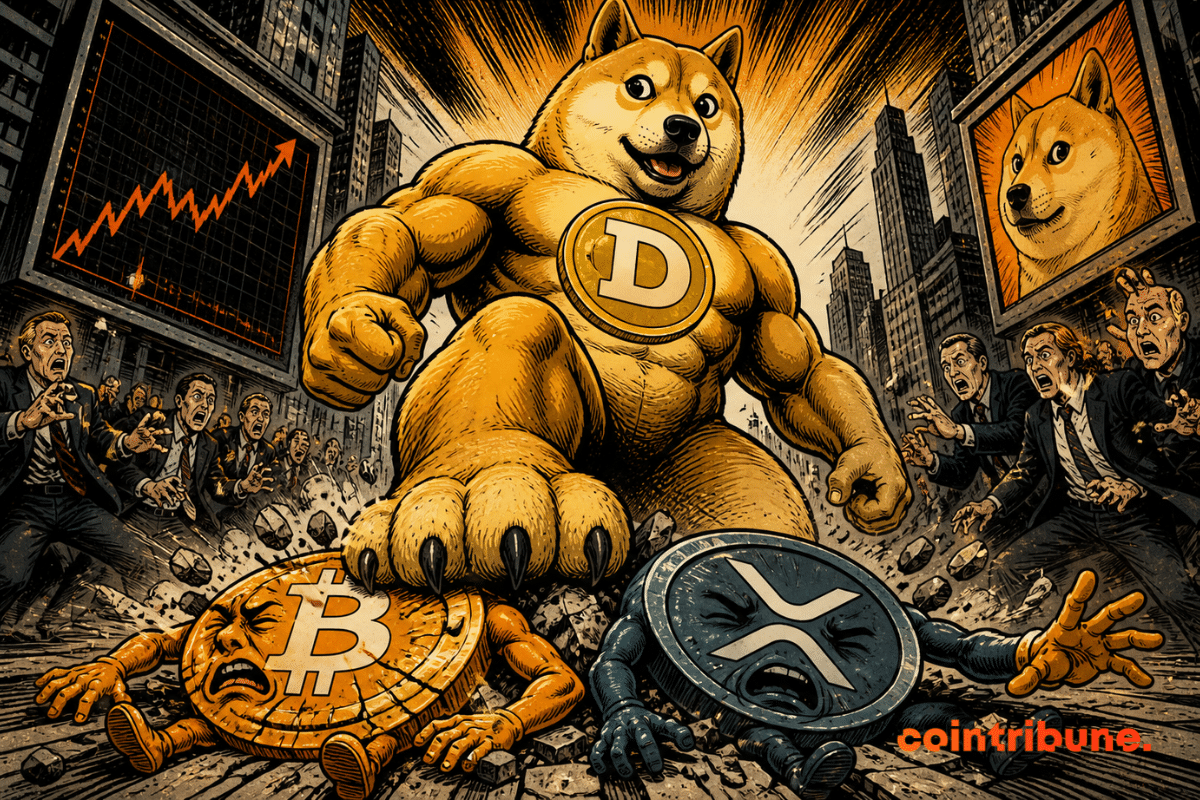
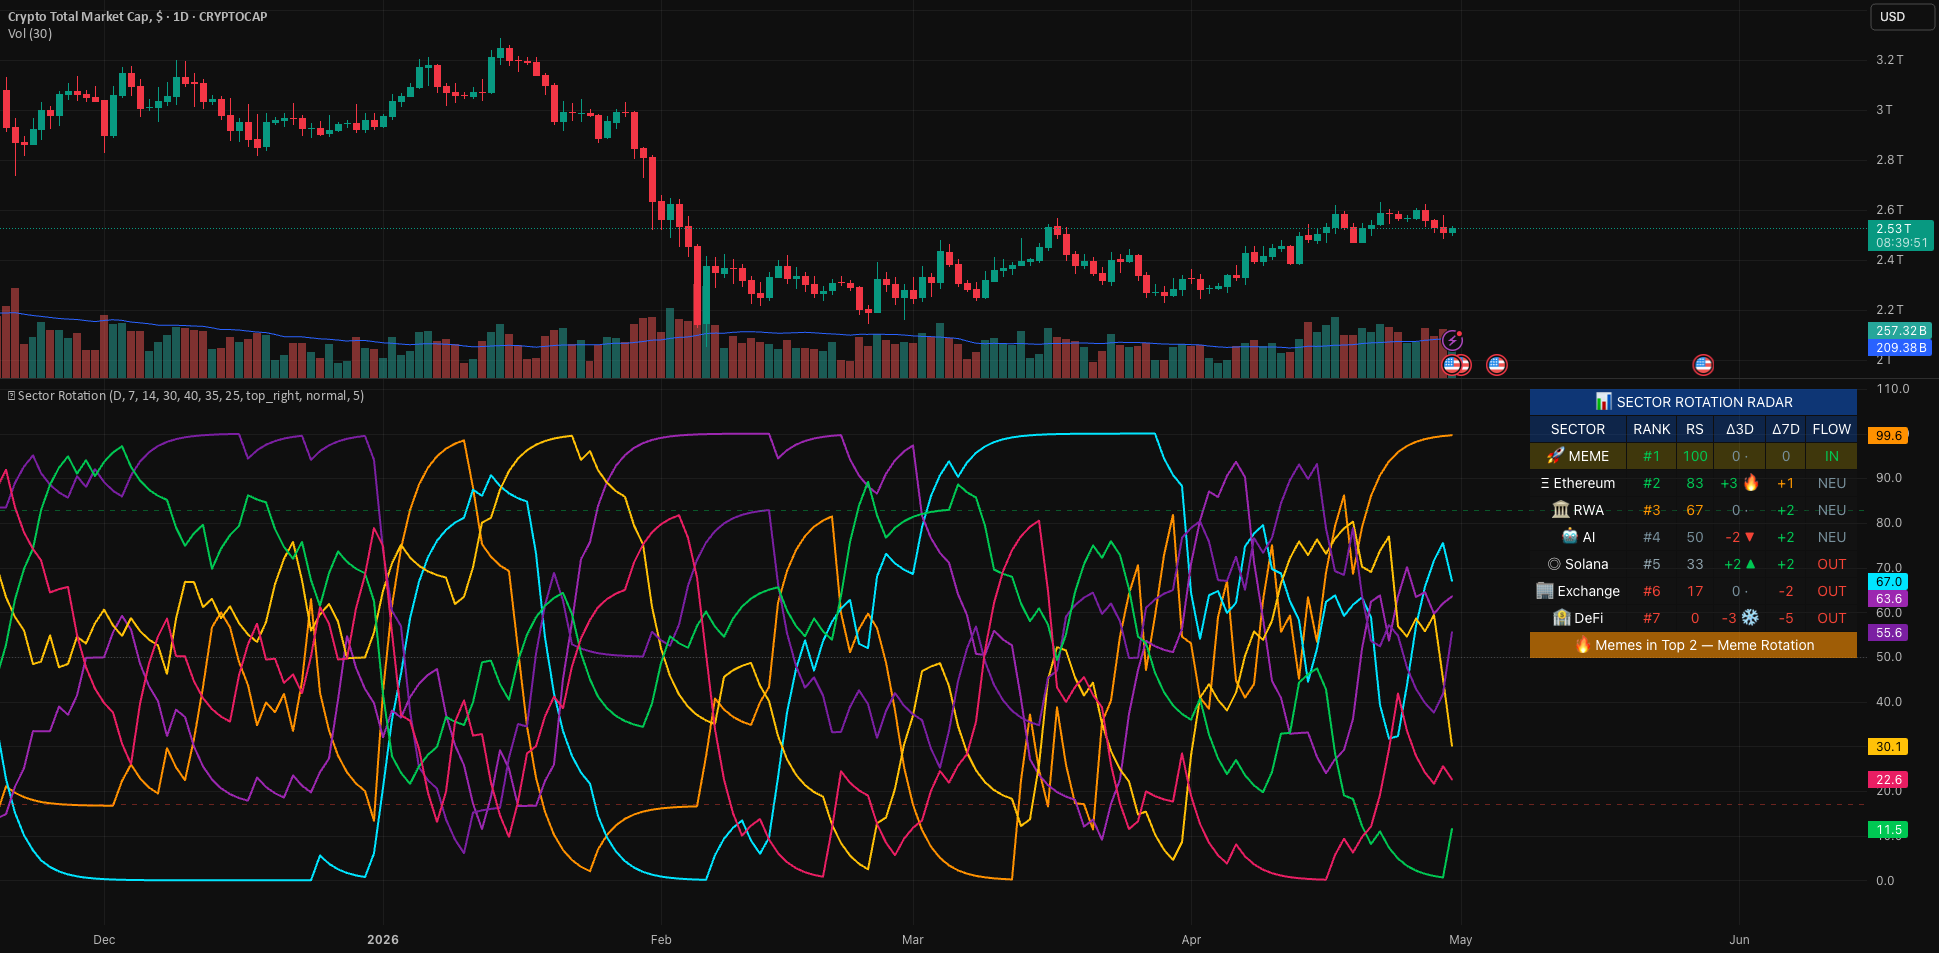
$110B Gone From Meme Coins and $DOGE Is Holding Better Than Most
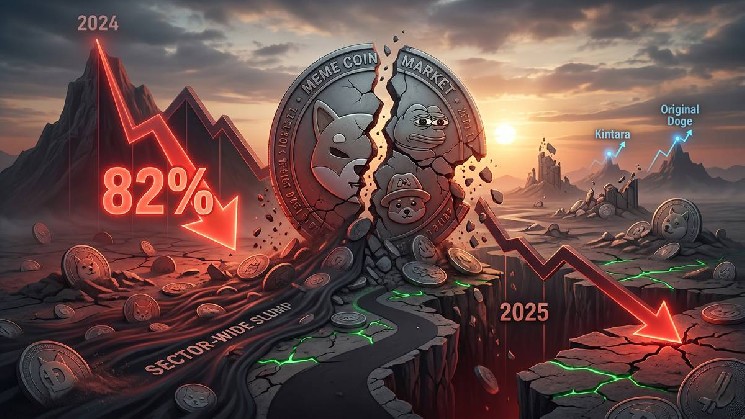
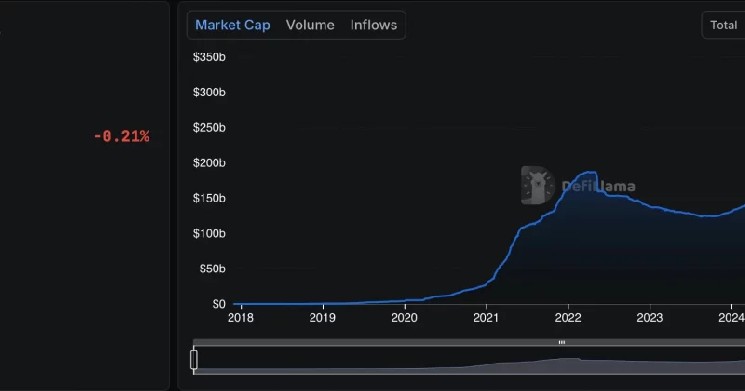
📉 $110B Gone: The Collapse of the Meme Coin Boom
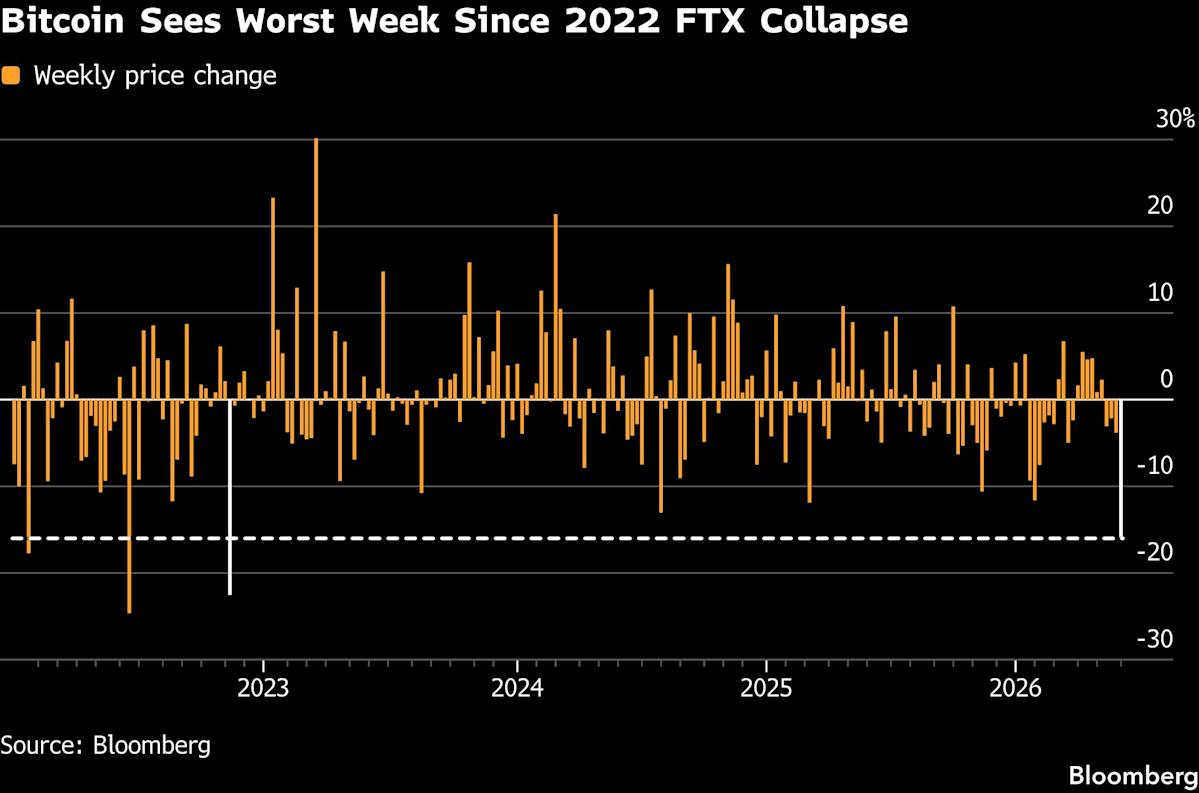
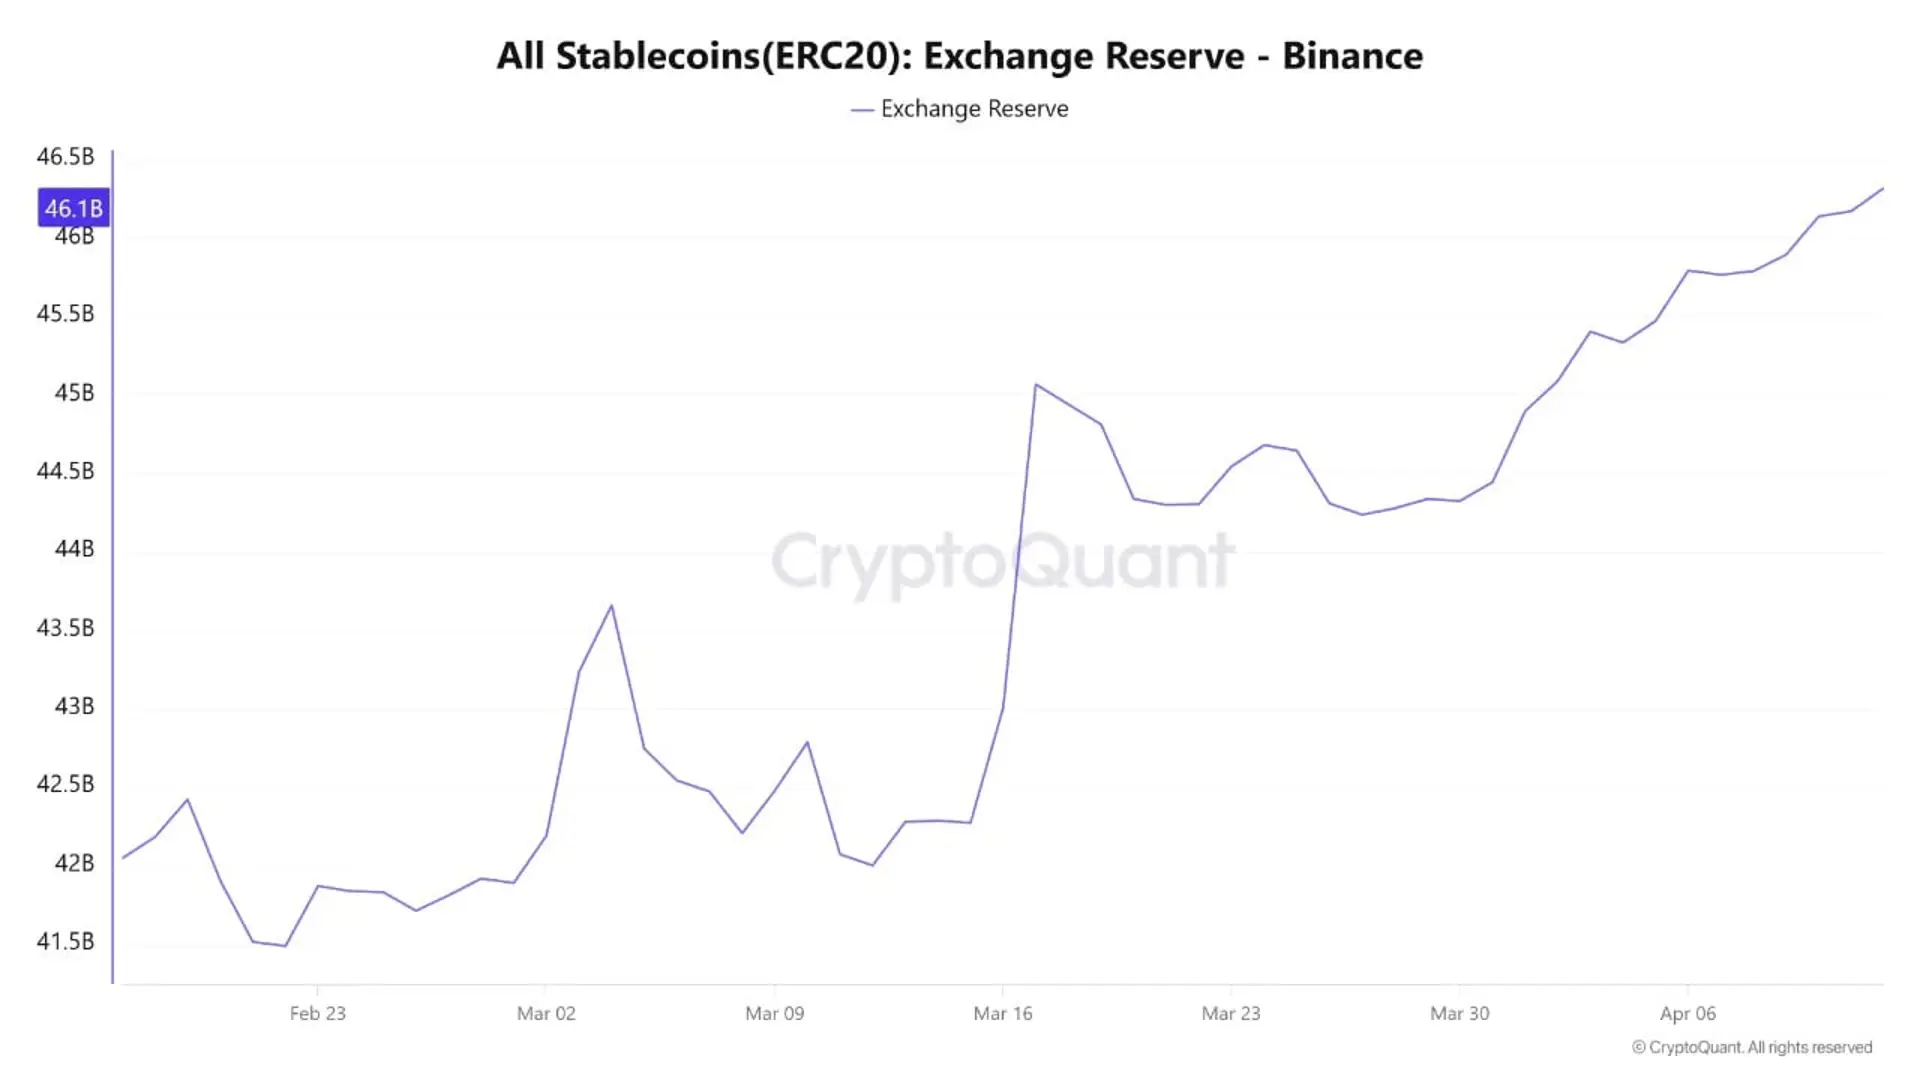
In November 2024, the category’s combined market cap reached $135.06B, but by June 15, 2026, it had fallen to $24.48B. This represents an 81.9% decline from its all-time high.
The sector has also remained under pressure… pic.twitter.com/o2edohmZlv
— CryptoRank.io (@CryptoRank_io) June 16, 2026
The combined meme coin market cap hit $135.06B in November 2024 and has since collapsed to $24.48B by June 15, an 81.9% decline. The sector posted a 31.3% loss year to date in 2026 alone, with multiple failed recovery attempts throughout 2025 unable to rebuild the prior cycle’s momentum.
$DOGE has held its $0.08 support through the broader sector collapse, which is notable given that smaller meme coins have seen near-total drawdowns. Whether $DOGE’s relative resilience reflects genuine demand or simply slower bleed depends entirely on whether the $0.087 floor holds through today’s FOMC decision.
$DOGE Derivatives: Options Positioning Builds Quietly
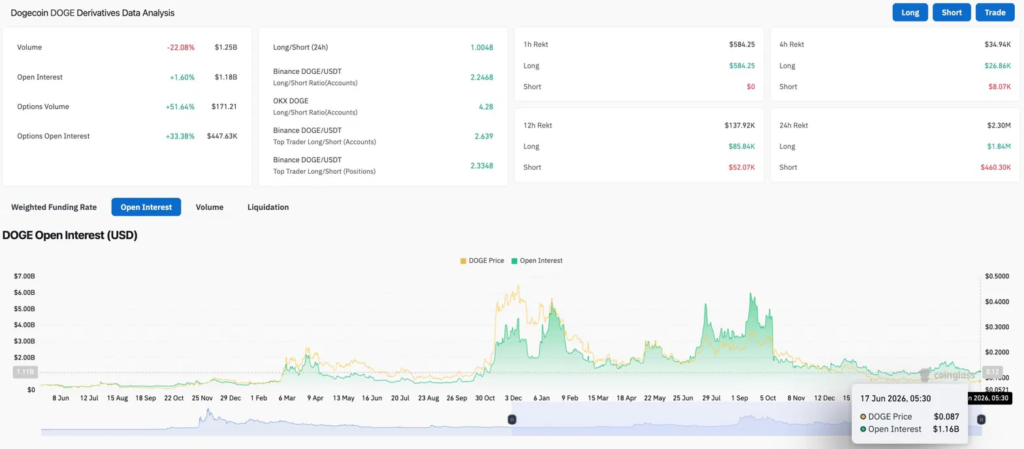
Volume fell 22.08% to $1.25B while open interest rose 1.60% to $1.18B. Falling volume with rising OI points to new positions being added without momentum chasing. Options volume jumped 51.64% to $171.21 and options OI surged 33.38% to $447.63K. Traders are buying defined-risk positions ahead of FOMC rather than leveraged spot exposure.
The long/short ratio of 1.0048 is dead neutral. Over 24 hours, $1.84M in long positions were liquidated against $460.30K on the short side. Longs absorbed most of the pain in the current range.
Dogecoin Price Prediction for June 18, 2026
- Upside: A hold above $0.087 and a close above the Supertrend at $0.08993 targets $0.092. A dovish FOMC or hold decision with no hawkish surprises adds the macro catalyst needed to push through resistance.
- Downside: A close below $0.087 breaks the channel and puts $0.08 back in play. A hawkish FOMC surprise accelerates that scenario and brings the candle range low into direct focus.