Key Insights:
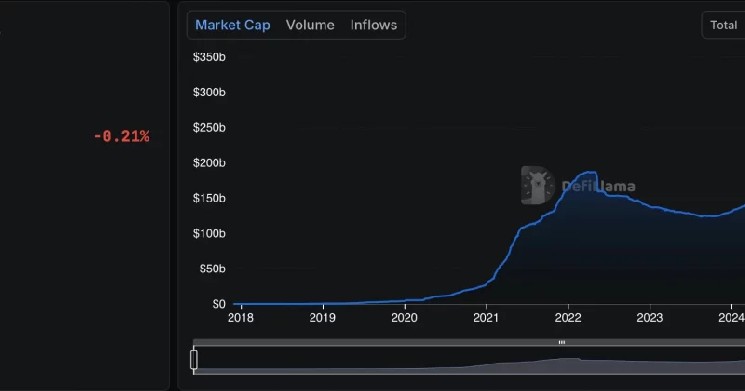
- The market cap of cryptocurrencies outside the largest assets is building a base after an extended correction.
- OTHERS/BTC is testing long-term support previously associated with altcoin rotations in 2018 and 2021.
- Forecasts of 10-fold, 50-fold, or larger gains remain speculative until market-wide breakouts appear.
Altcoin traders are watching several long-term indicators for signs that the market’s prolonged correction may be nearing its end. Rising support levels, improving momentum, and developing reversal patterns have attracted renewed attention across assets outside the largest cryptocurrencies.
Although the current setup resembles parts of previous market cycles, the available data does not confirm that a new altseason has begun. Several analysts have also projected substantial upside, but those forecasts remain speculative until price confirms a broader breakout.
Altcoin Market Cap Repeats a Post-Halving Pattern
Satoshi Crypto compared the current market structure with the period surrounding the previous Bitcoin halving cycle. The chart shows 662 days between the earlier halving marker and the start of a large altcoin expansion.

The latest setup marks a similar period of about 650 days. In both cases, the market first declined sharply before spending months inside a horizontal accumulation range.
The historical chart attributes a 4,620% increase to the 2021–2022 expansion. It’s 2025–2026 comparison projects an 8,840% move from the current base, but that second figure represents a forecast rather than completed performance.
The useful part of the comparison is the sequence: correction, consolidation, and eventual breakout. The projected percentage is far less reliable since market size, liquidity and token supply differ from earlier cycles.
A sustained exit above the current accumulation range would provide the first meaningful confirmation. Until then, the chart shows a possible cycle resemblance rather than proof of another multi-thousand-percent rally.
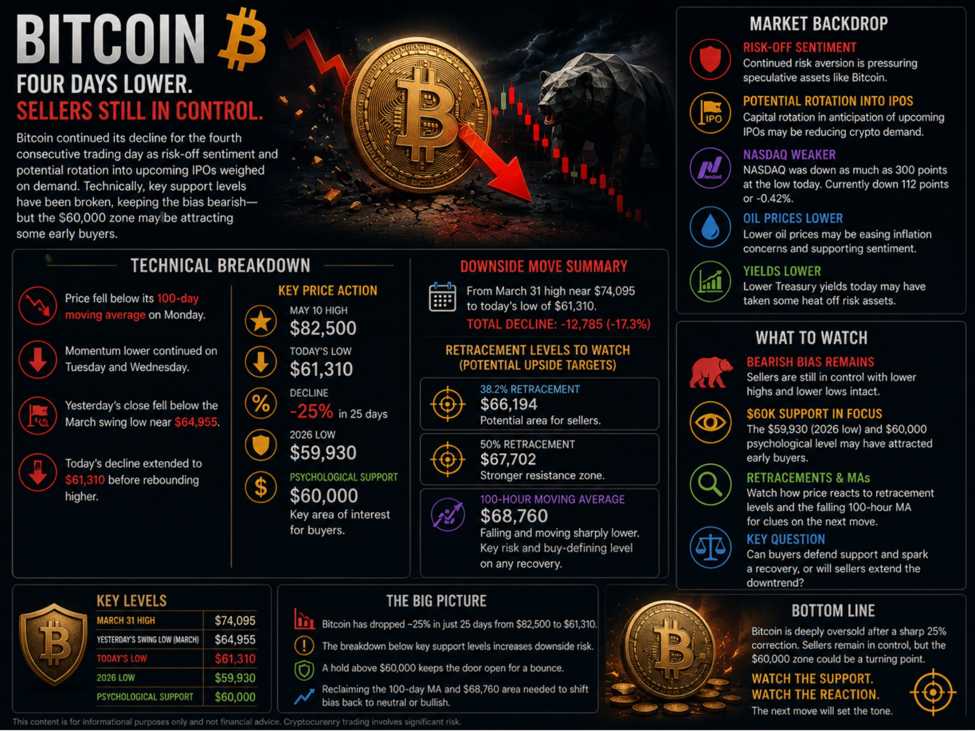
Bitcoin’s Structure Could Influence the Rotation
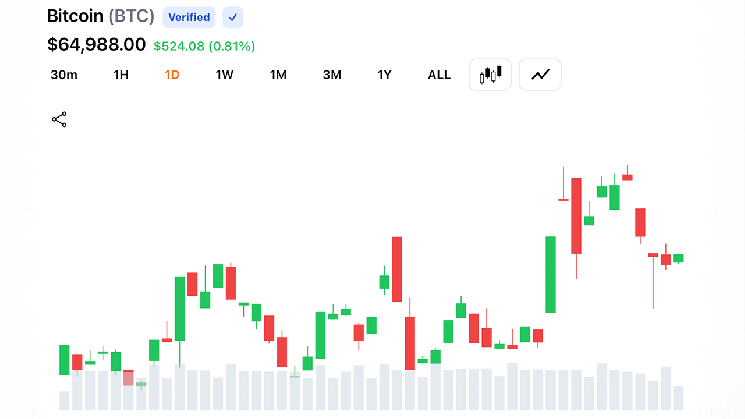
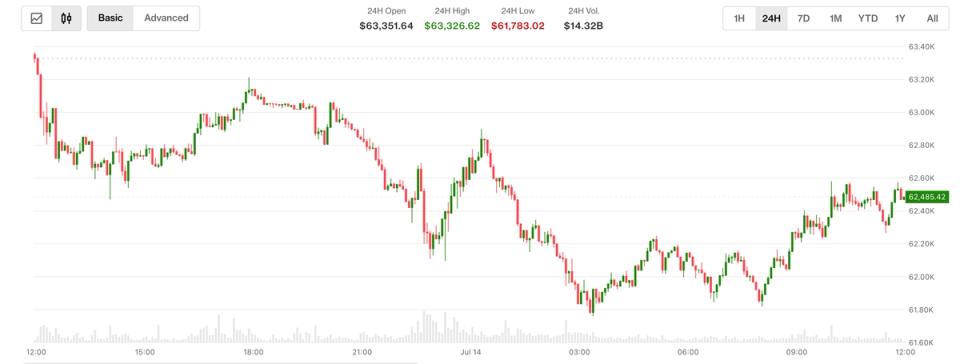
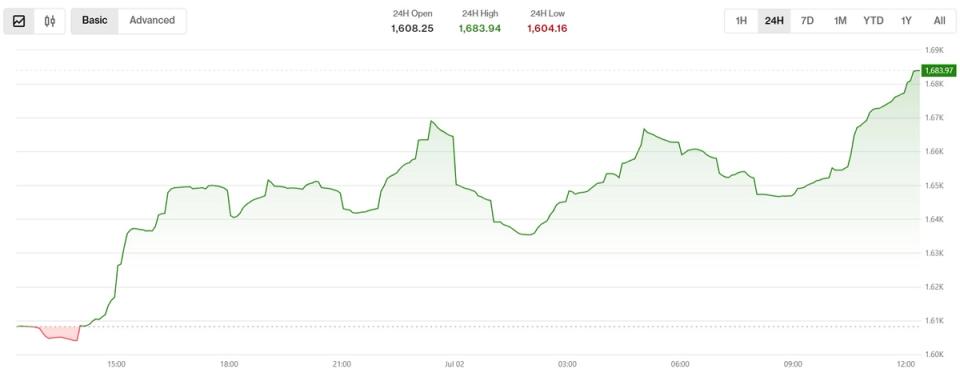
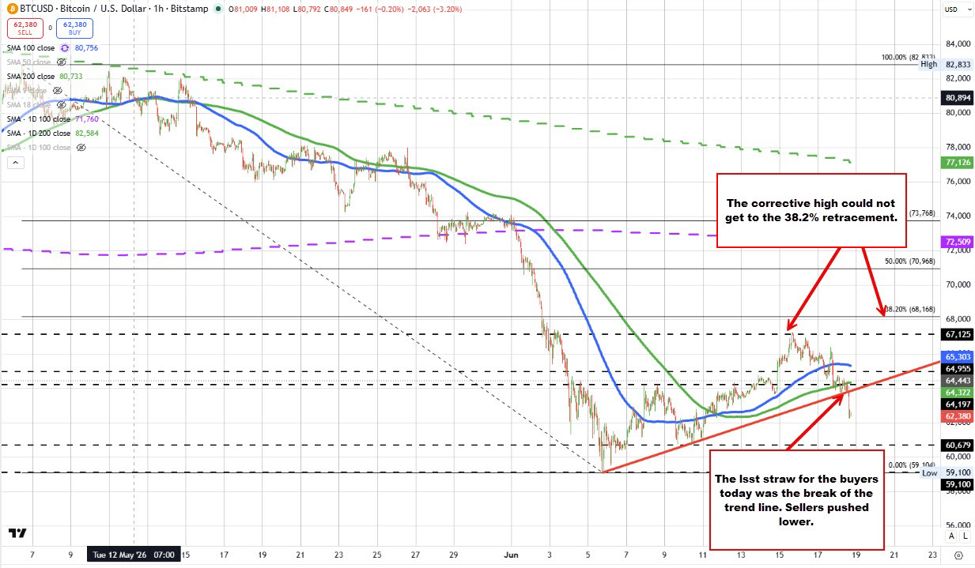
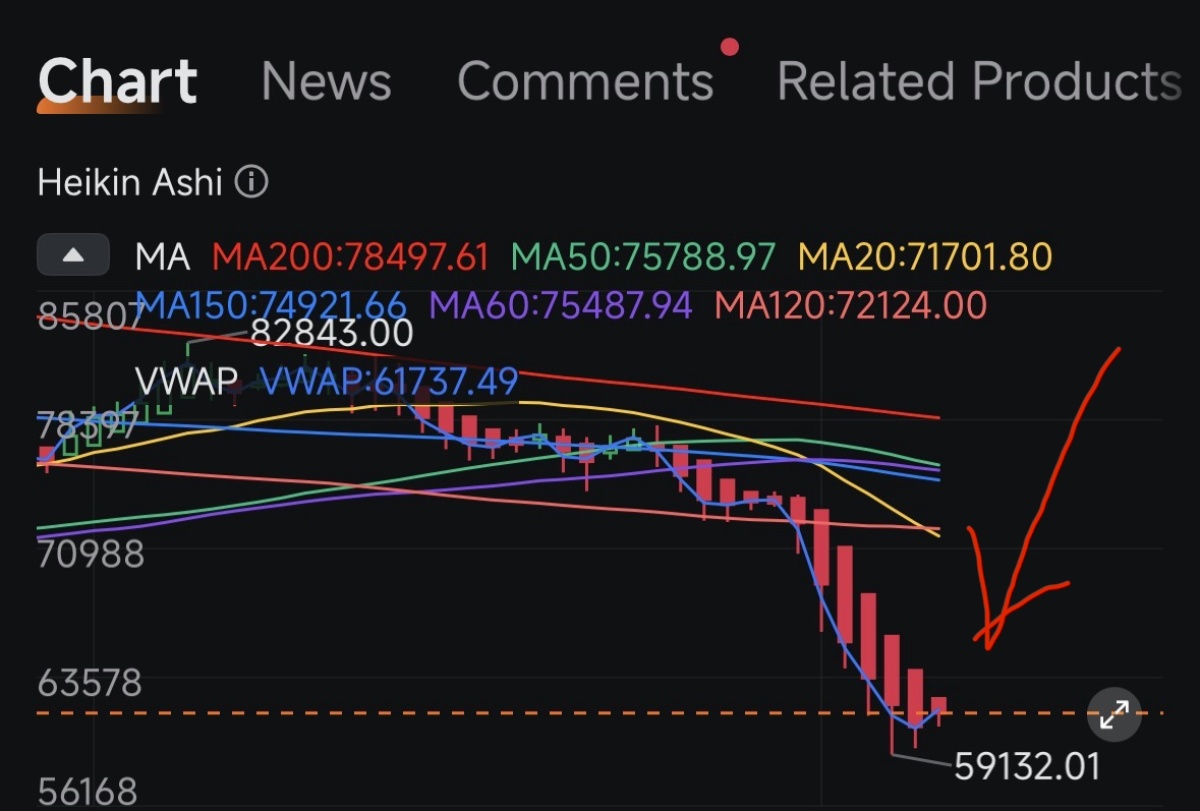
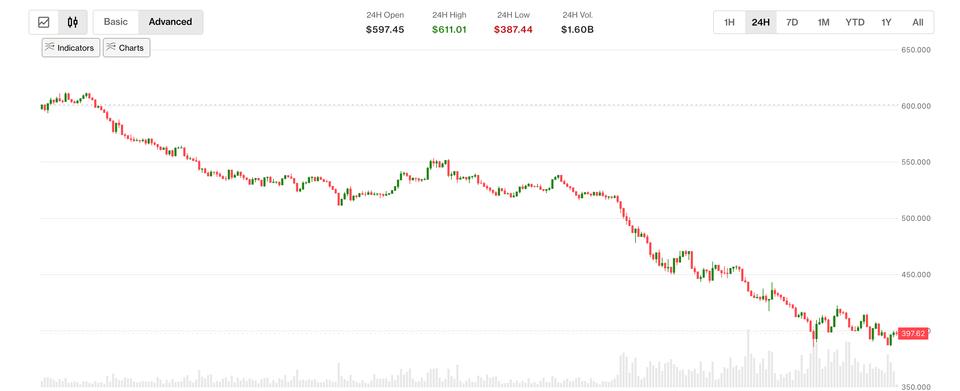
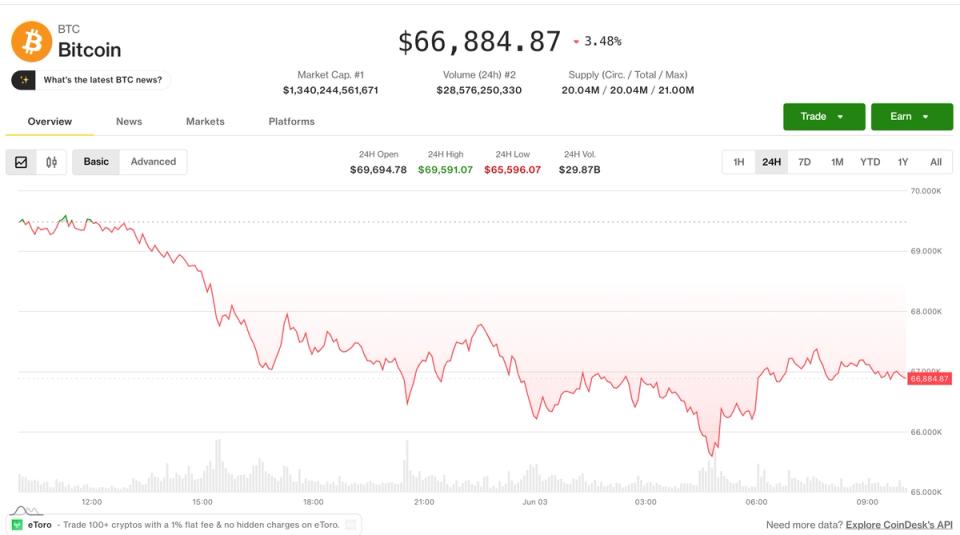
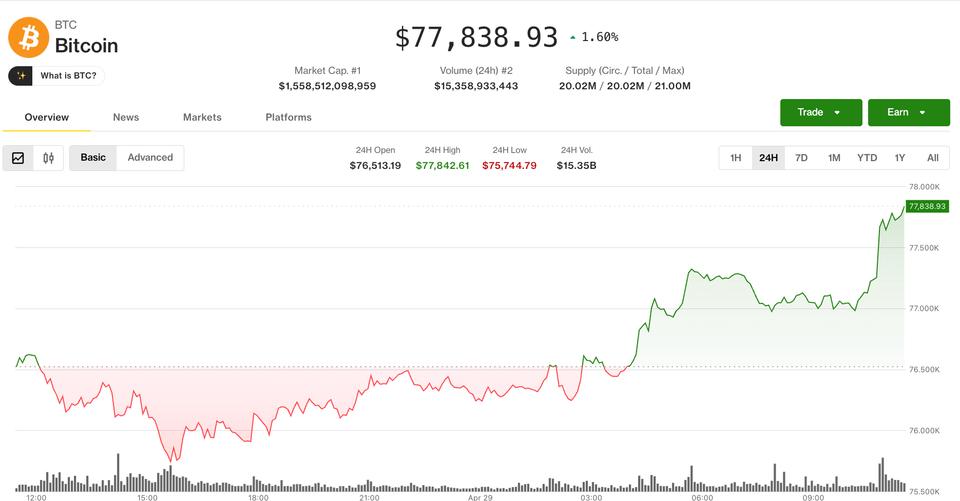
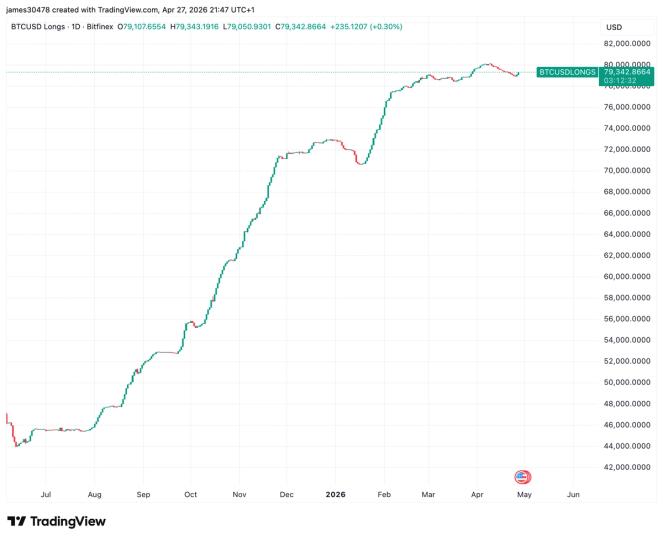
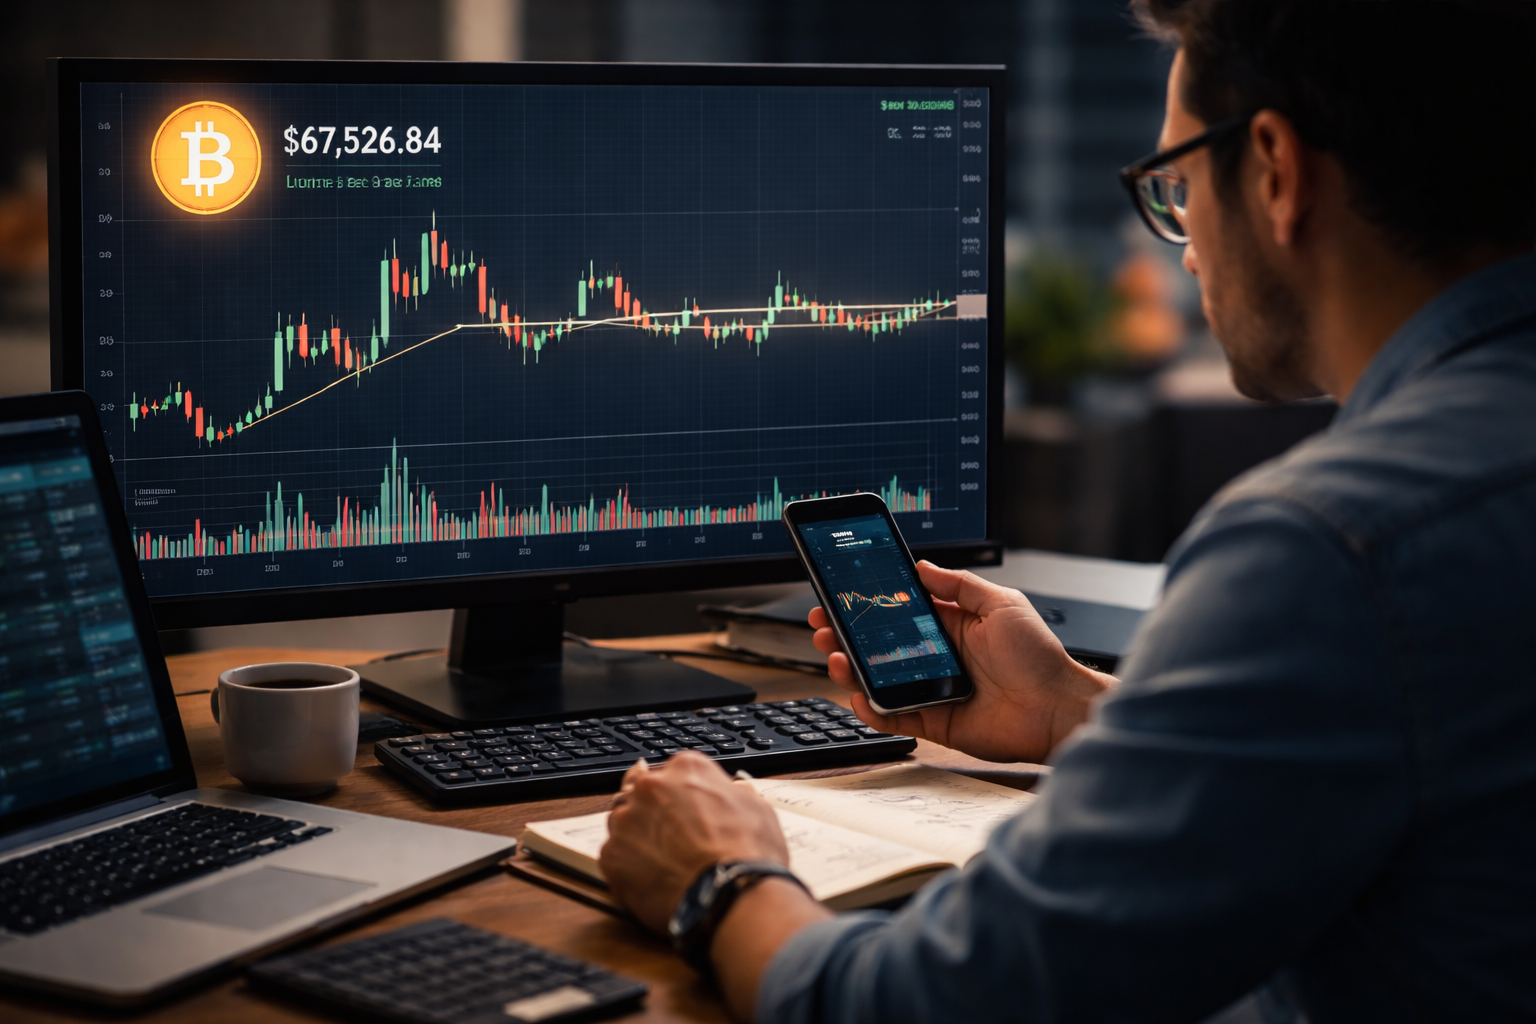
Meanwhile, Mr. BigDott views Bitcoin’s latest pullback as a possible higher macro low. His monthly chart connects the 2020 and 2022 bottoms with an ascending trend line that now intersects the 2026 market near $60,000.

Bitcoin traded around $67,300 in the supplied chart after briefly moving near the former breakout region. The projected path assumes that the rising support line holds and that BTC later advances toward $145,000 and eventually $375,000.
That forecast carries major uncertainty, yet the support test matters for altcoins. Smaller assets often struggle when Bitcoin is falling rapidly, while a stable or recovering BTC market can create conditions for capital to rotate elsewhere.
The immediate requirement is therefore not a move toward $375,000. Bitcoin first needs to preserve its higher-low structure and avoid another sharp breakdown below the highlighted support band.
A stable Bitcoin market would strengthen the altcoin case. Renewed BTC weakness could delay the rotation and keep liquidity concentrated in defensive positions.
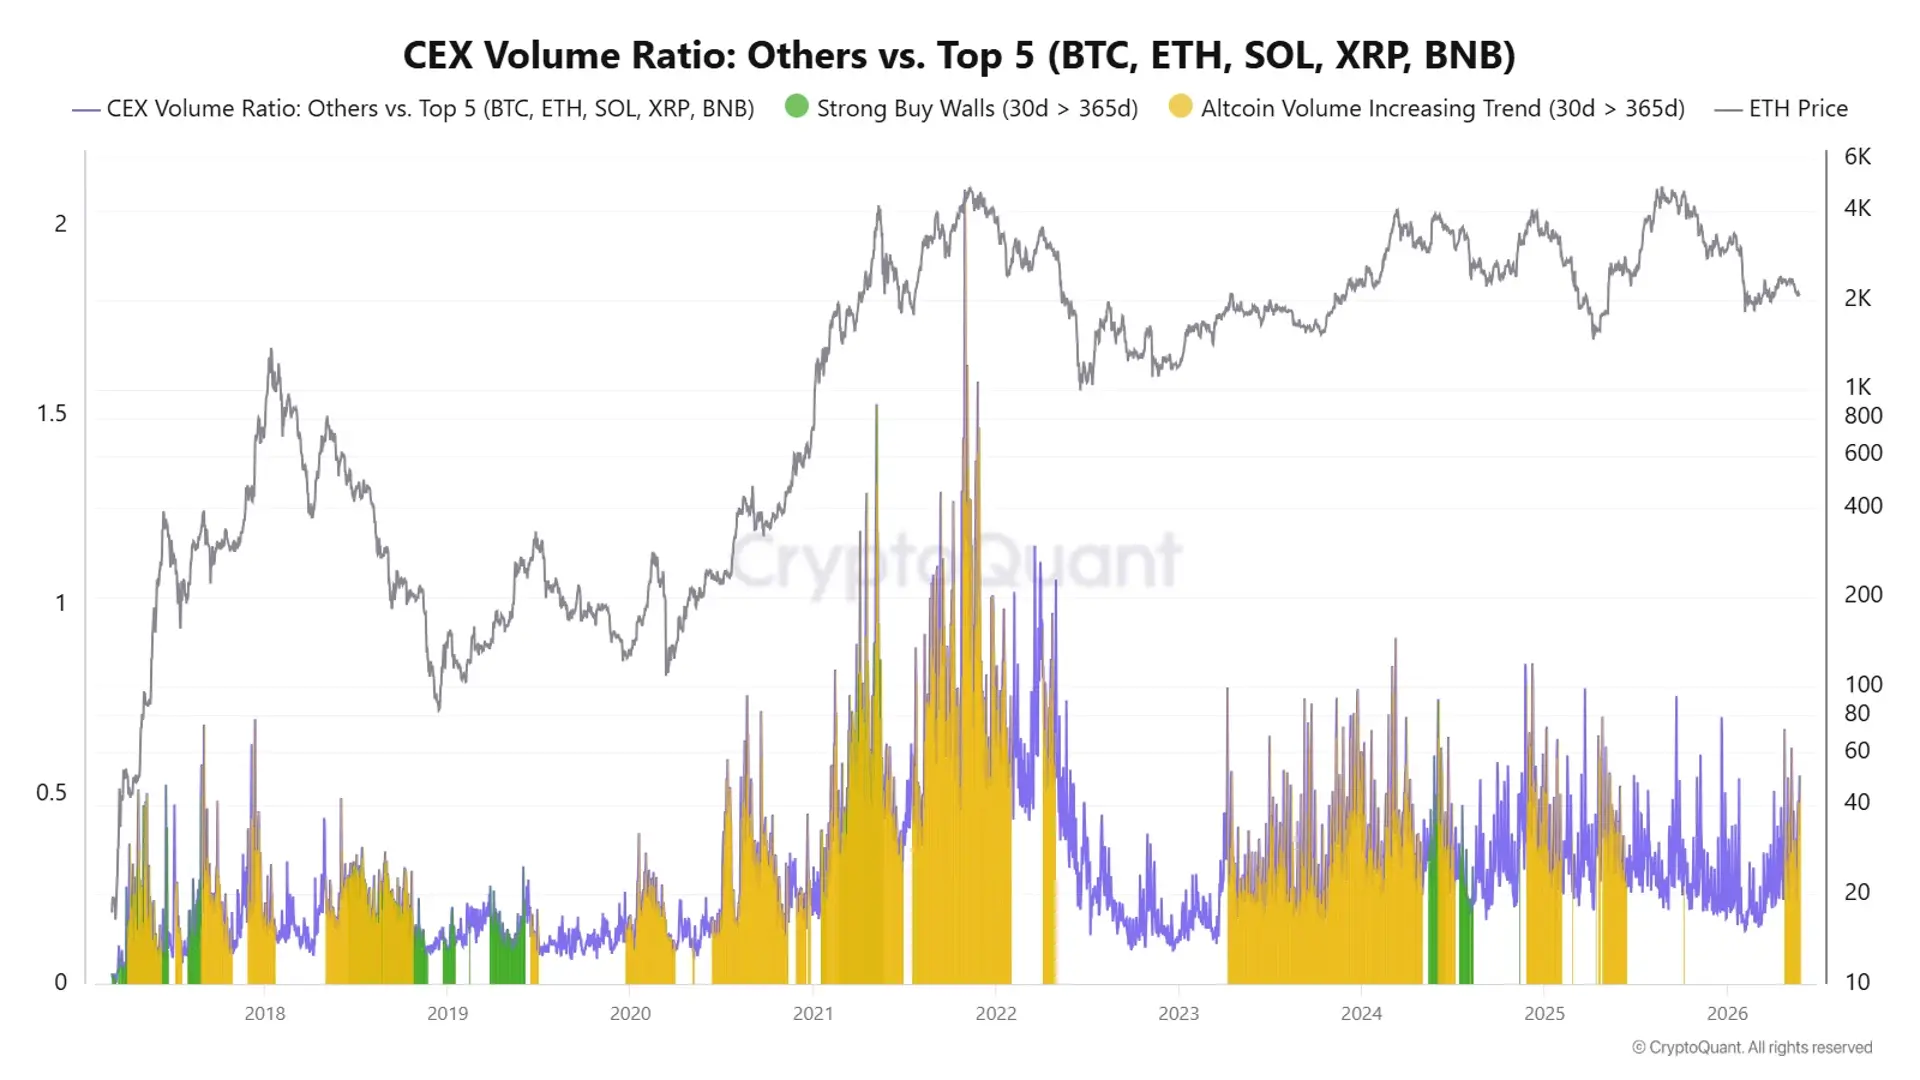
OTHERS/BTC Tests a Long-Term Rotation Zone
Additionally, Shahnawaz highlighted the ratio between cryptocurrencies outside the largest group and Bitcoin. OTHERS/BTC currently sits near 0.0876, close to a rising support line connecting earlier cycle lows.

The chart marks similar tests before the 2018 and 2021 altcoin seasons. Those periods later produced gains of approximately 407% and 523% in the ratio. The 2026 projection calls for another increase near 530%. Such a move would mean smaller assets substantially outperform Bitcoin, but price has not yet confirmed that outcome.
The present ratio must first hold its rising support and move above the nearby moving averages. Continued trading below those averages would show that Bitcoin still commands a stronger relative position.
Falling Wedge Offers the Clearest Confirmation Test
Notably, Moustache compared the current altcoin-dominance structure with falling wedges completed in 2019 and 2023. Both earlier patterns ended with upward breaks and periods of stronger performance.

The latest chart shows dominance outside the top 10 near 7.96%. Price appears to have moved beyond the upper boundary of a declining wedge and is attempting to establish support above the breakout area.
Momentum has also improved. The weekly RSI pushed through a descending resistance line and recently moved above the midpoint before easing slightly.
This creates a clearer confirmation test than the aggressive return forecasts. Holding above roughly 7.7%–8% would preserve the breakout attempt, while a move through 9%–9.5% would signal broader participation.
The post Altcoin Season Signals Build as Market Structure Mirrors Earlier Cycles appeared first on The Market Periodical.