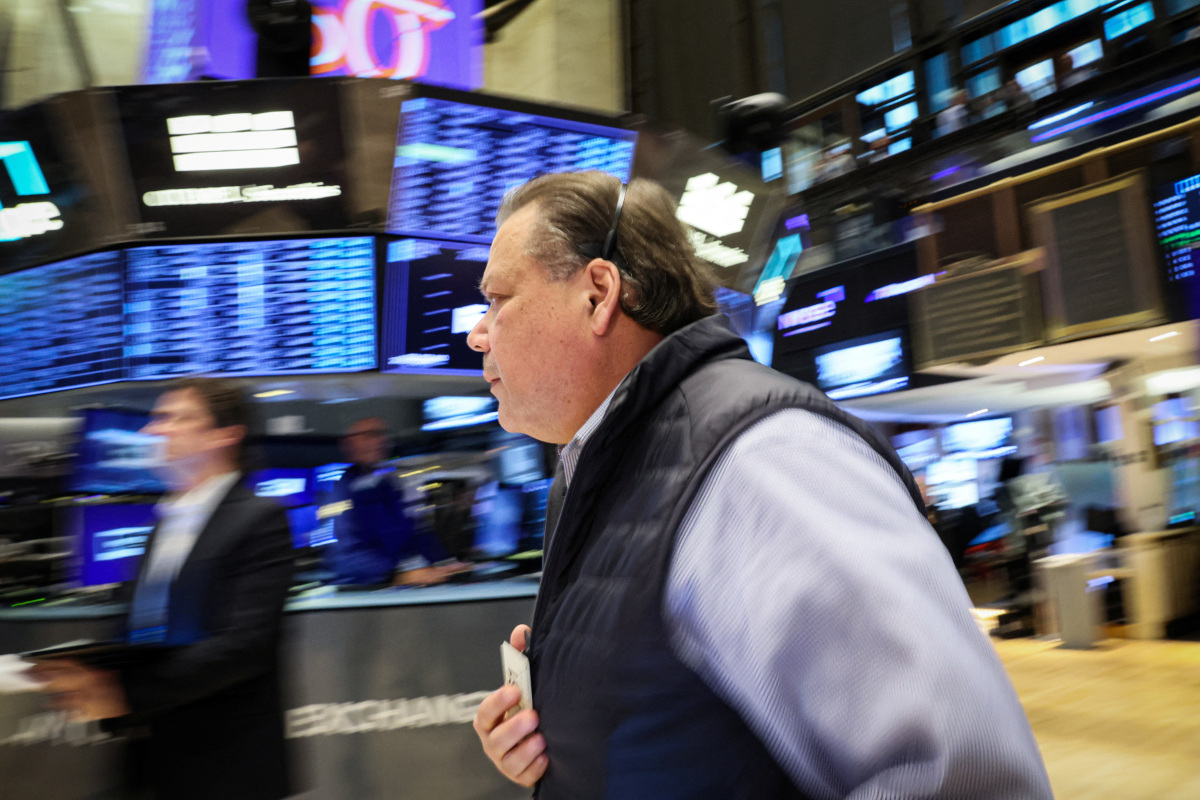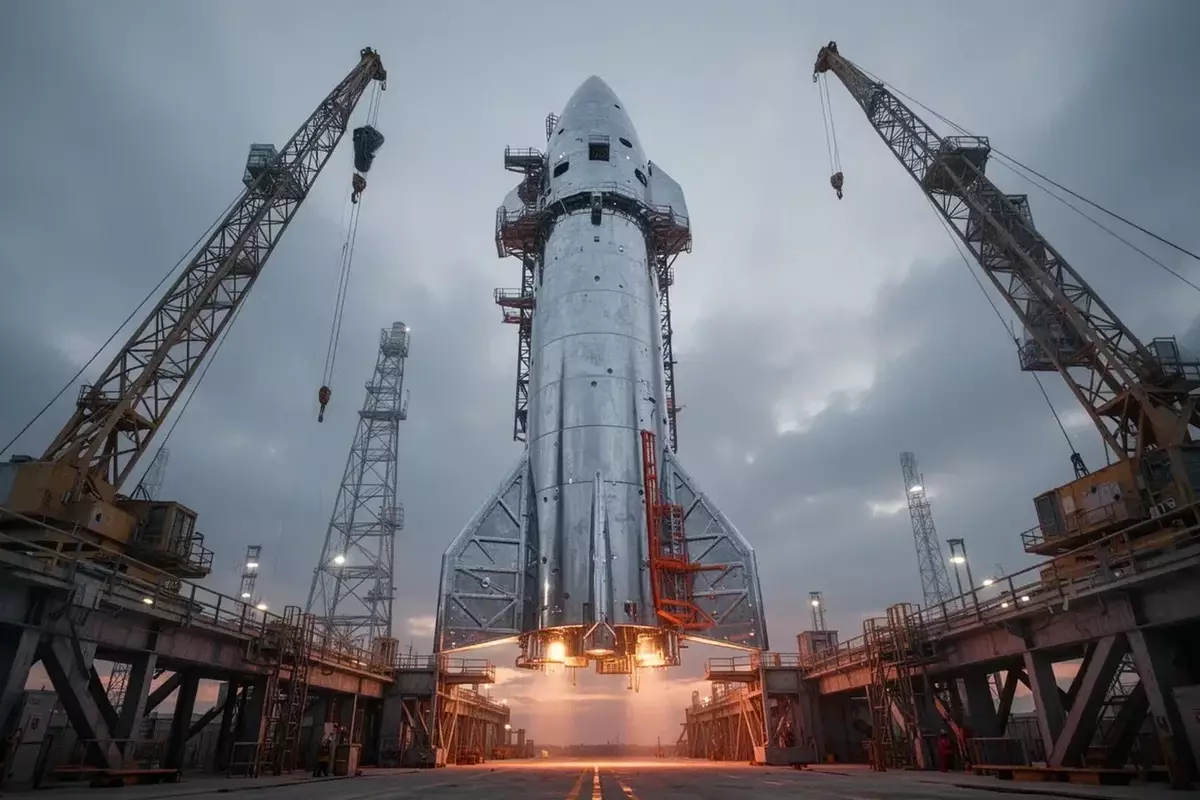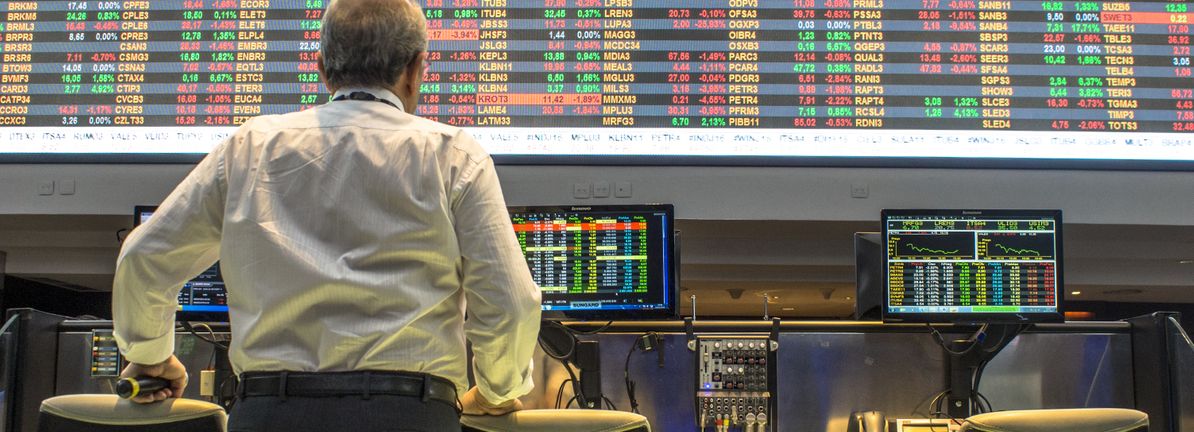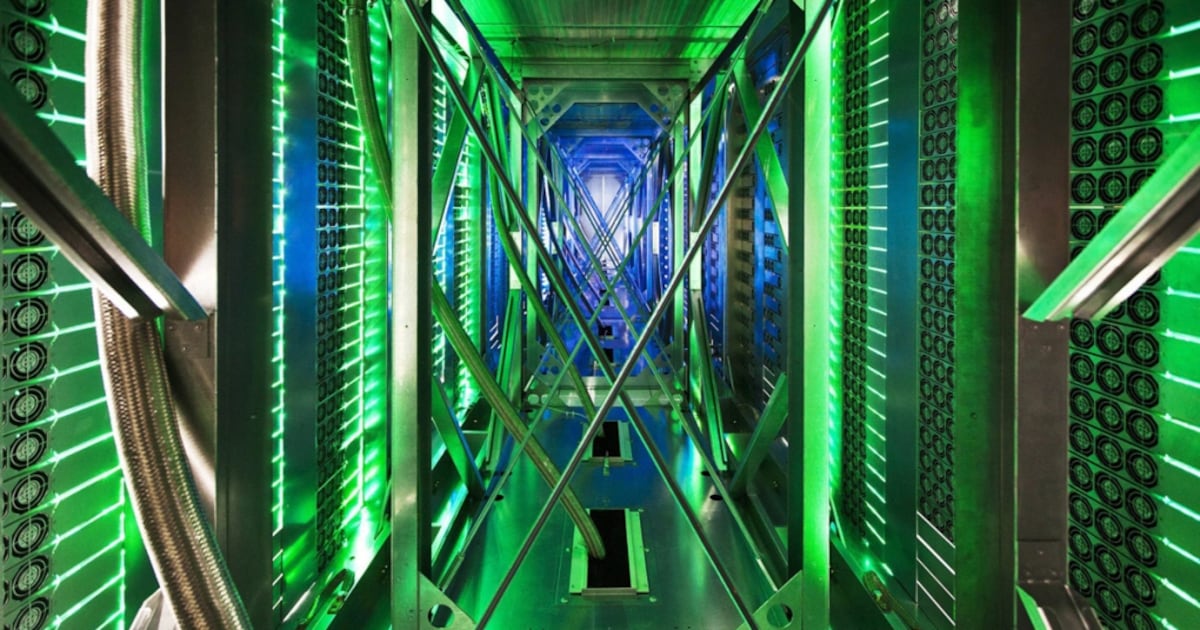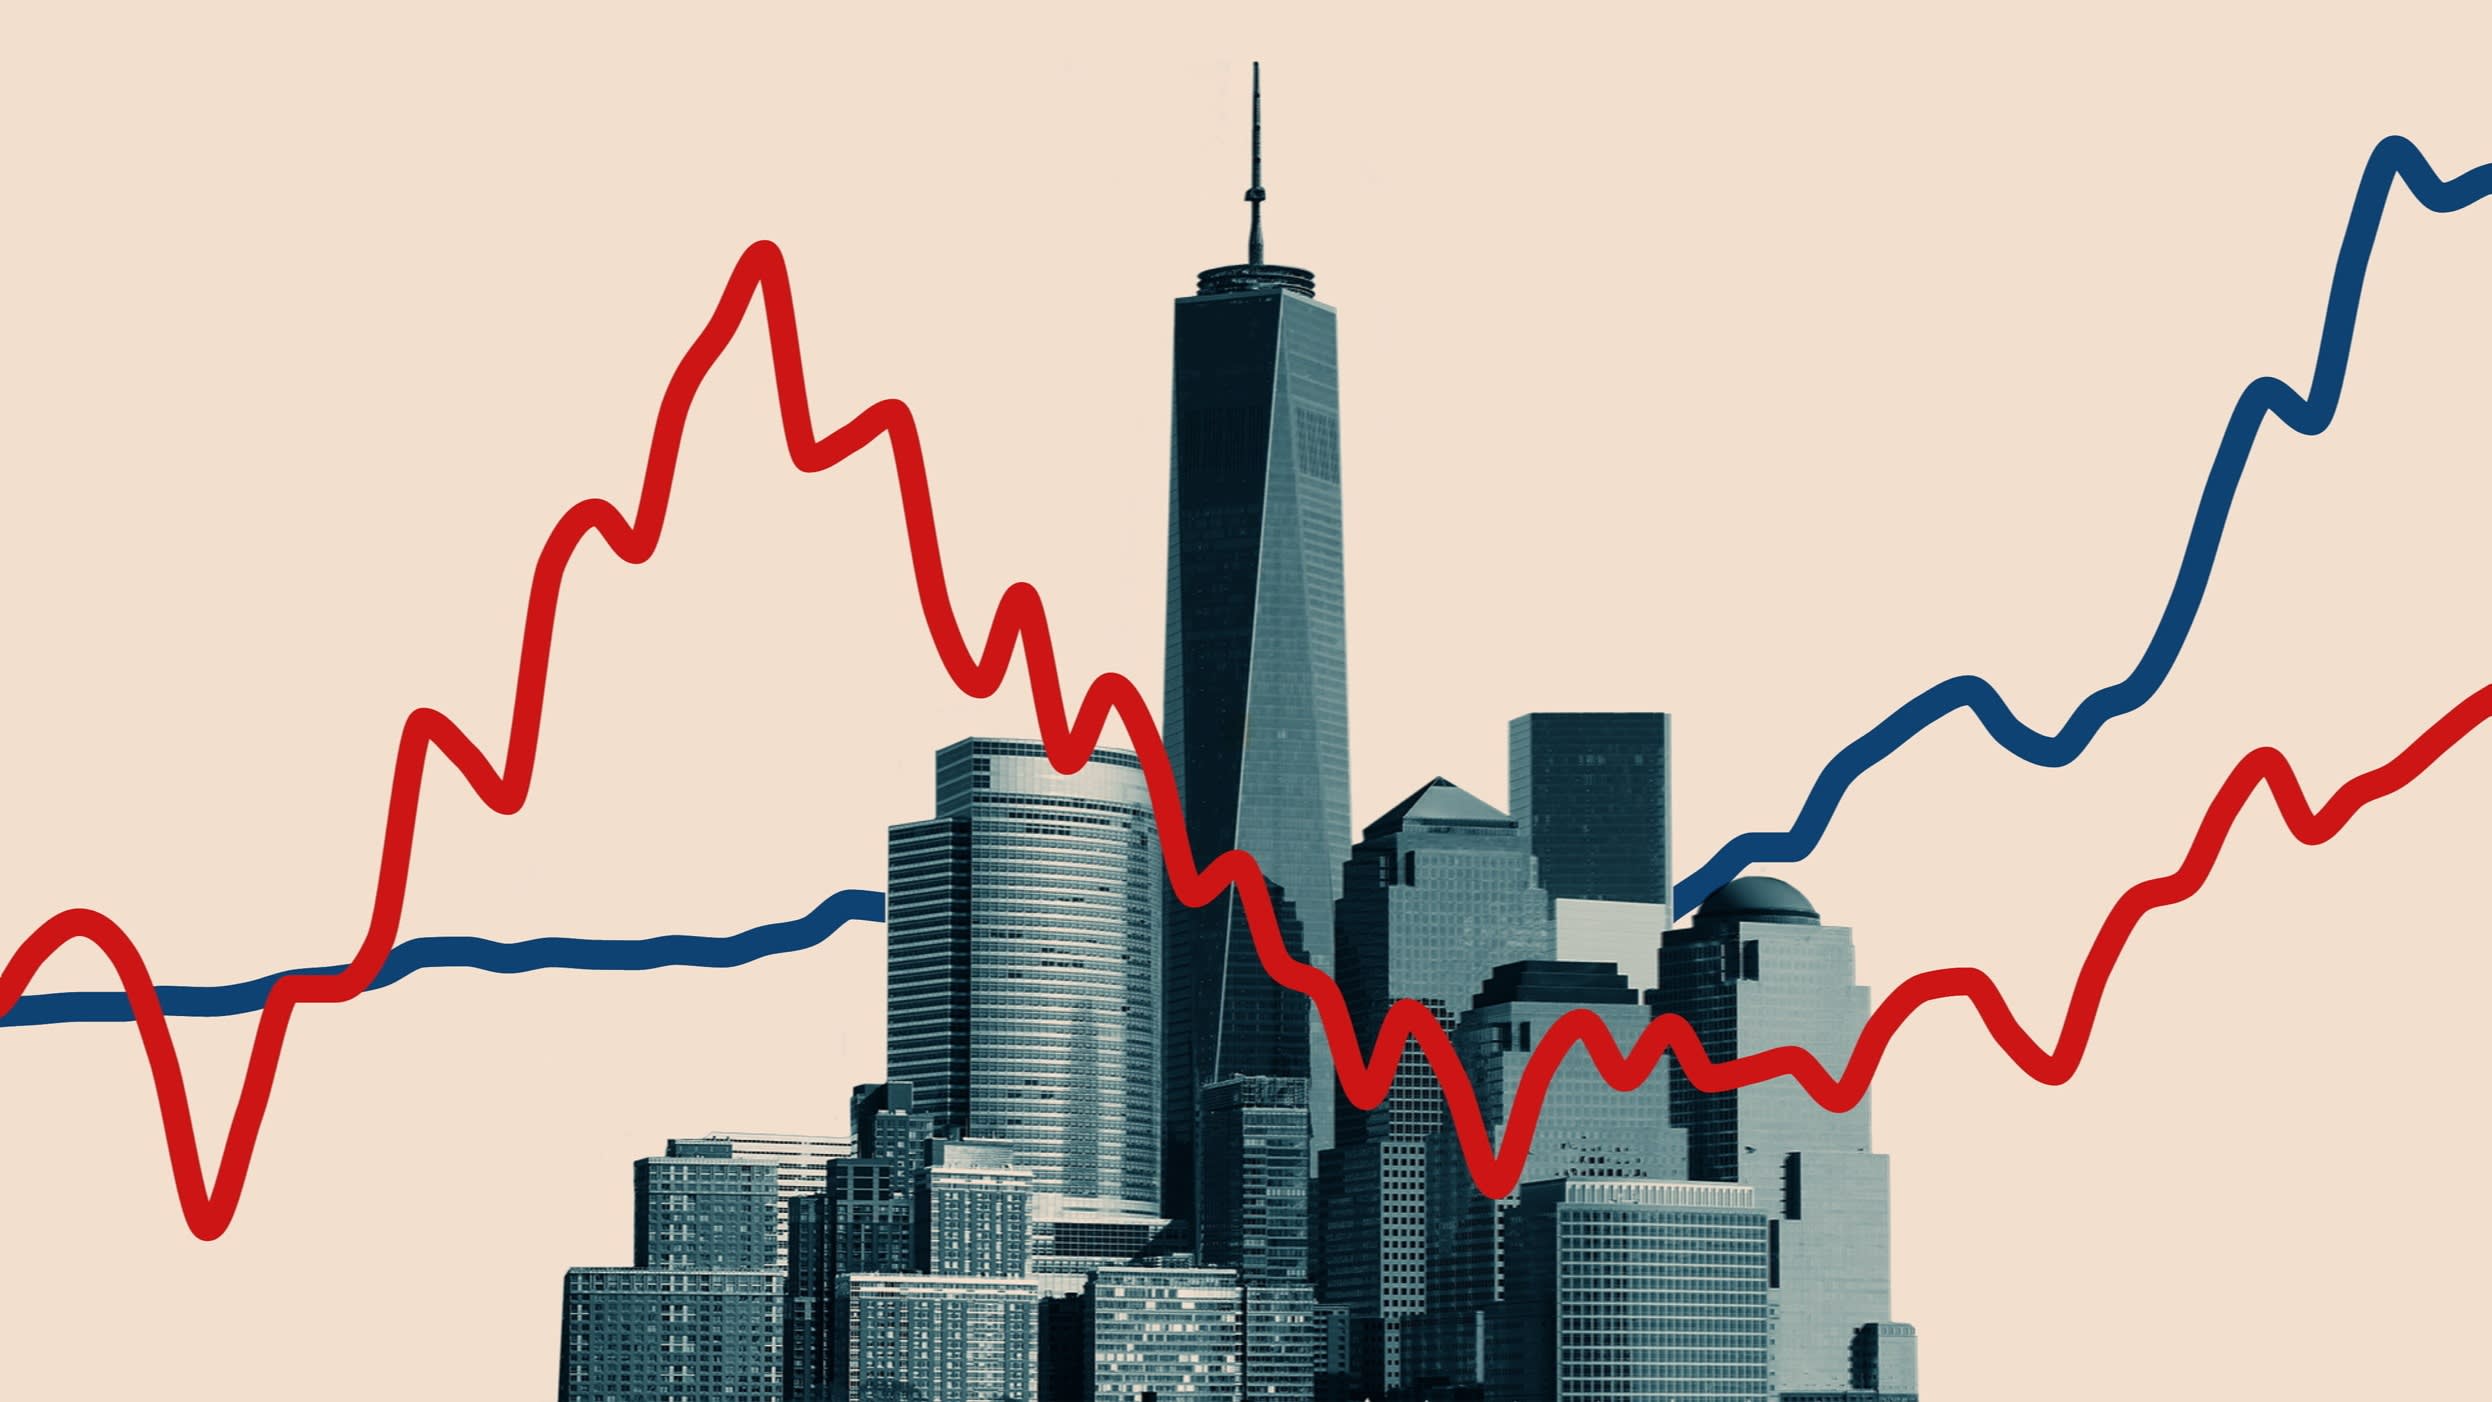

Hyperscalers will sell hundreds of billions of dollars in bonds to build data centers this year. One of the country’s largest bond managers says the math no longer favors buyers.
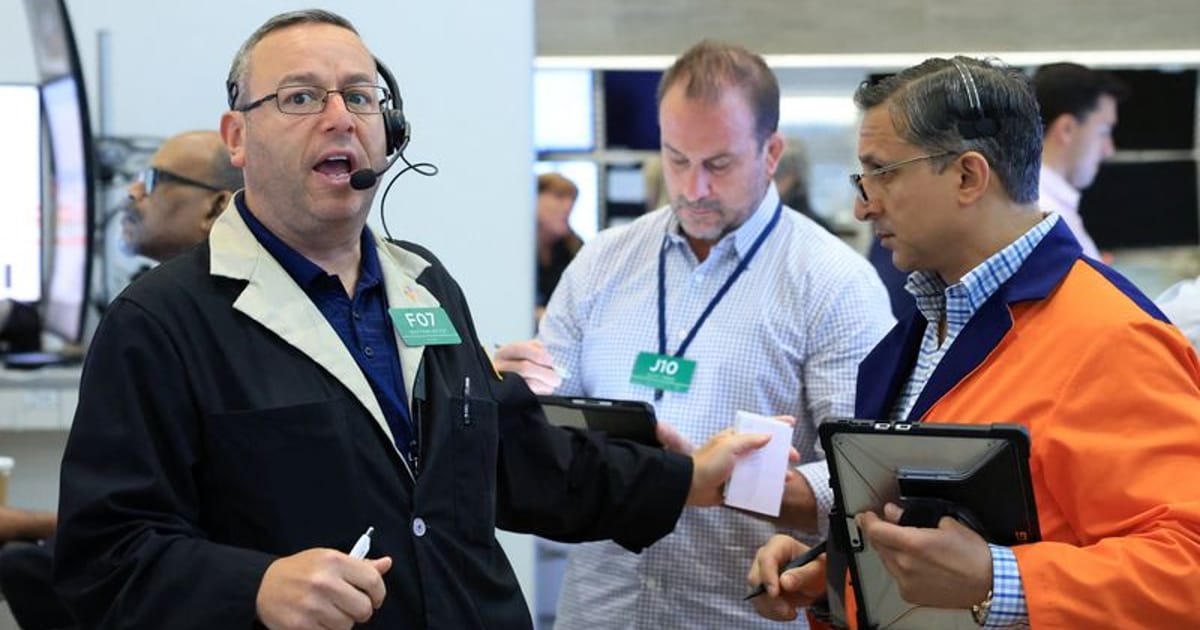
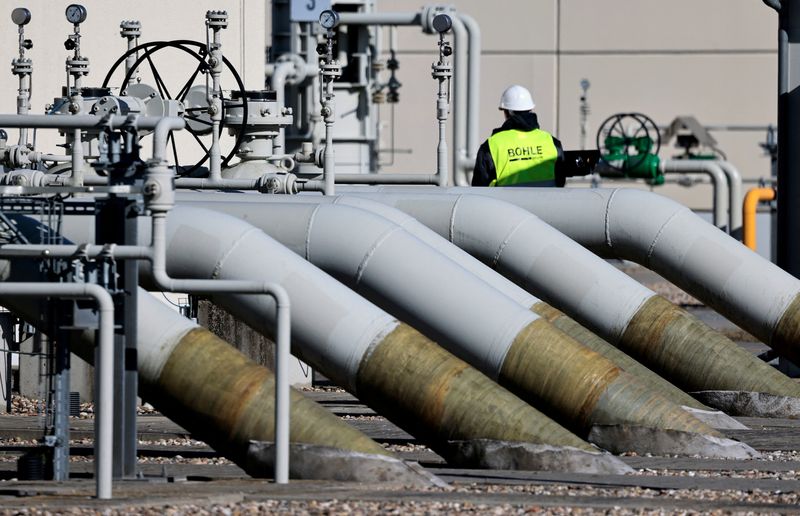
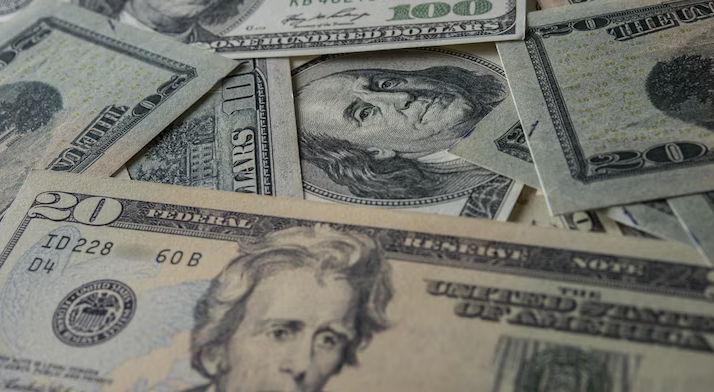
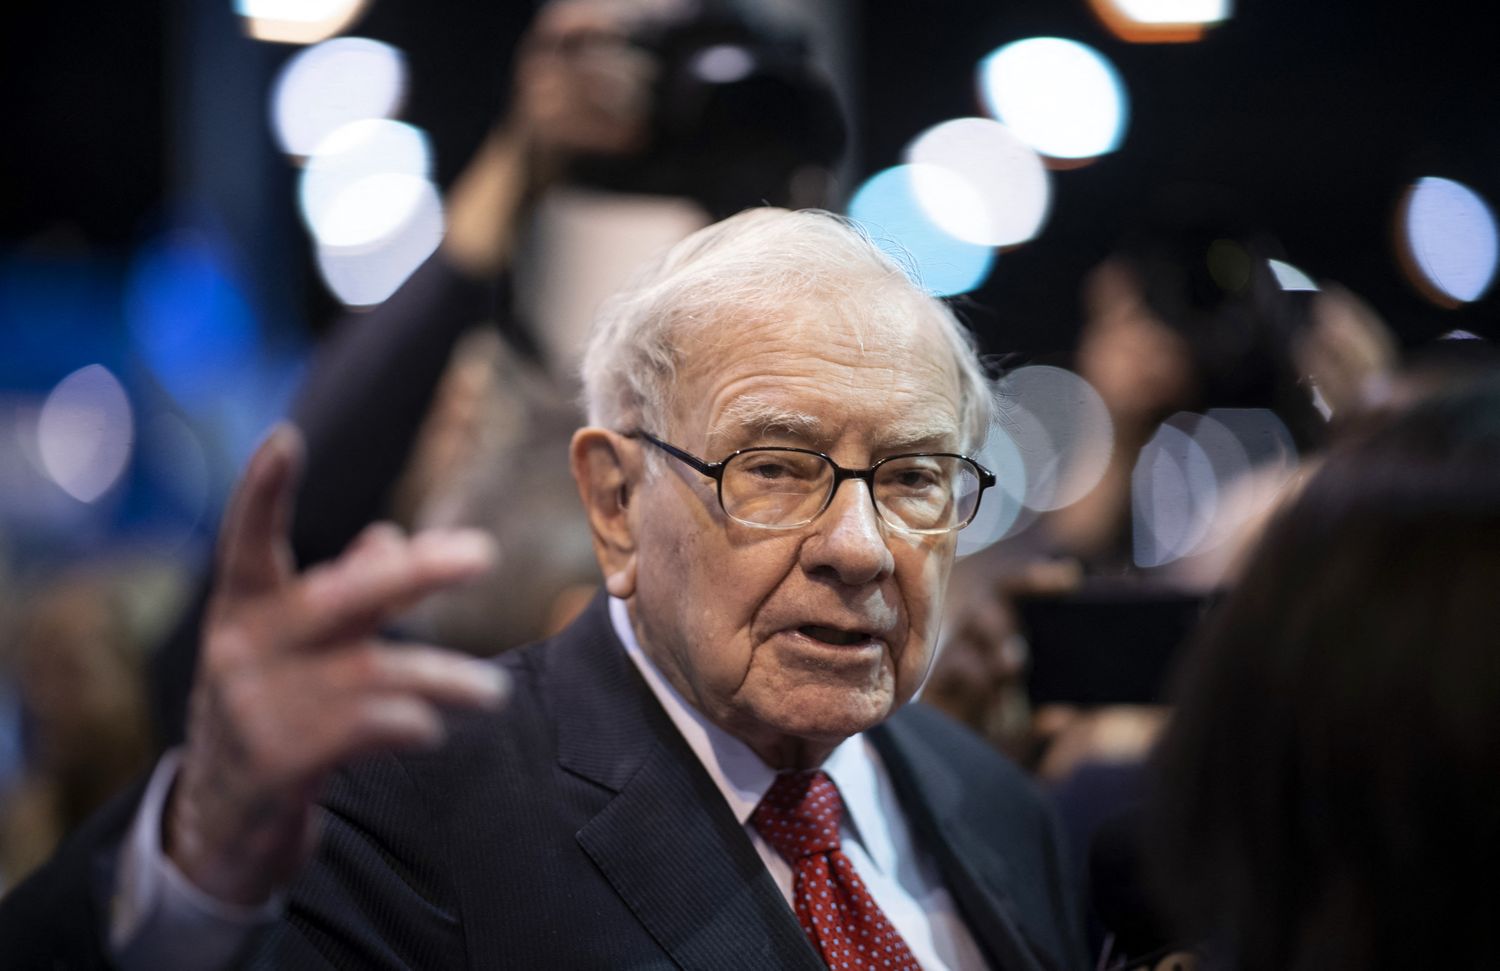
NurPhoto via Getty Images
The artificial intelligence boom has spent three years as a stock market story. This year it became a bond market problem.
In its midyear outlook, published June 3, Fidelity told clients it is steering its core bond portfolios away from one of the fastest-growing slices of the investment-grade market: the wave of new debt that Amazon, Alphabet, Meta, Microsoft and Oracle are selling to pay for data centers, chips and the power to run them. The reason is not that Fidelity expects these companies to miss a payment. It is that buyers are no longer being paid enough to take the risk.
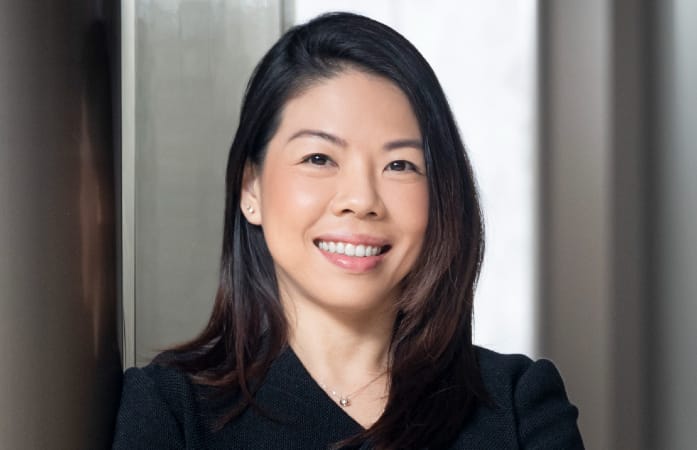
“Investors aren’t well compensated to own corporate securities right now,” Stacie Ware, who co-manages the Fidelity Total Bond Fund, said in the outlook. She singled out the new AI deals. Because the five big technology borrowers carry high credit ratings, their bonds trade at only a small yield premium over U.S. Treasurys. That leaves little room for error and almost no room for reward.
A wall of new supply
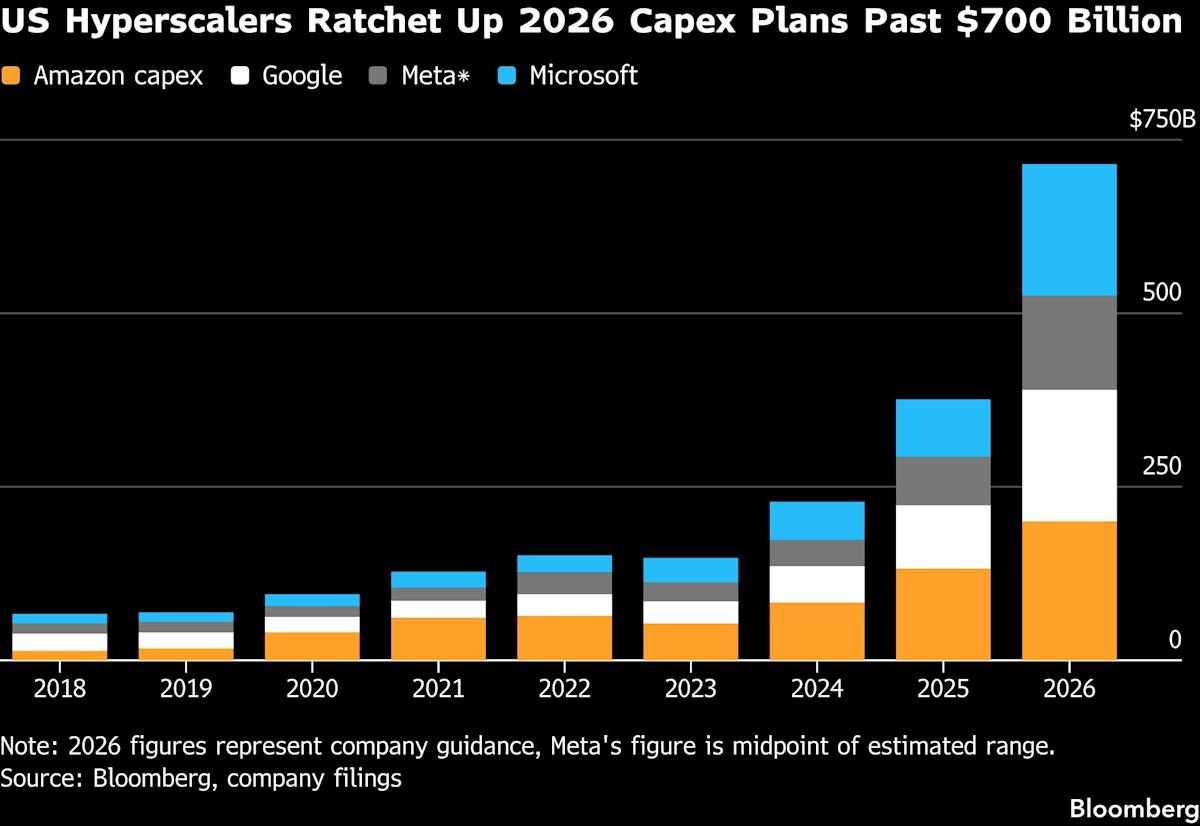
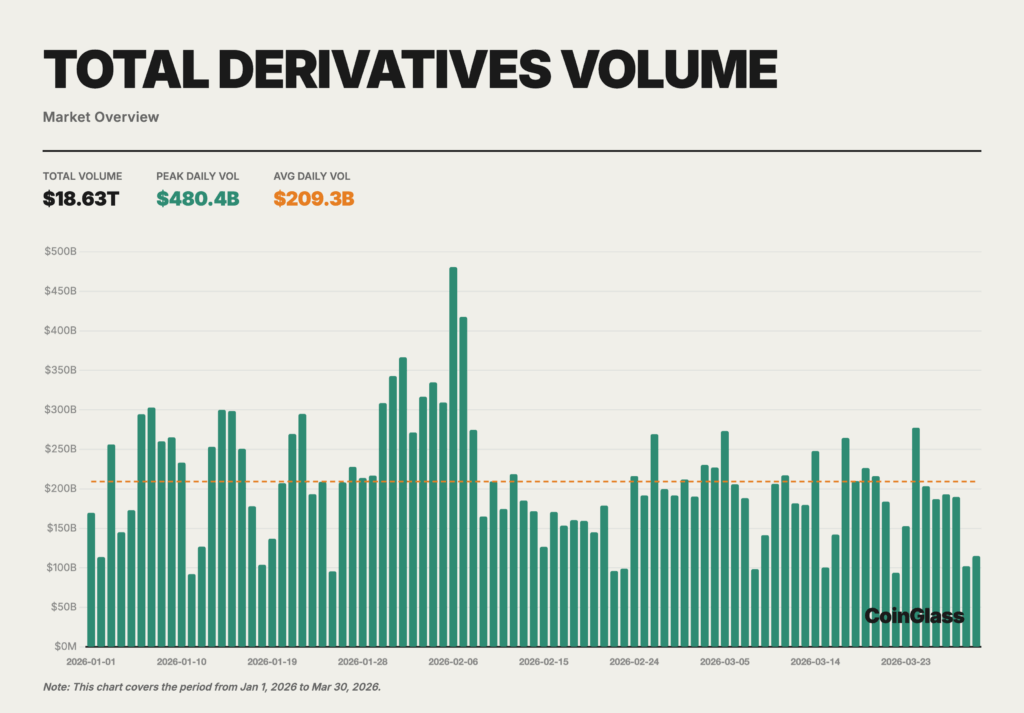
The supply is the part that is hard to ignore. Several hundred billion dollars of new debt is expected to come from hyperscalers and other large technology borrowers in 2026, according to Fidelity, all of it tied to the build-out of data centers and related infrastructure. The figure is not a forecast pulled from the air. The same five companies sold roughly $121 billion of U.S. corporate bonds in 2025, more than four times their average of about $28 billion a year between 2020 and 2024, according to a January report from BofA Securities cited by Reuters.
The individual deals have been large enough to move the whole market. Oracle sold $18 billion of bonds in September. Meta followed in October with a $30 billion offering, the largest non-merger high-grade bond sale on record. Alphabet raised $17.5 billion and Amazon $15 billion in November, according to a December analysis from MUFG, which found that hyperscalers accounted for four of the five biggest U.S. high-grade bond deals of the year. The pace did not slow in 2026. Alphabet raised about $31.5 billion in a February global offering that included a rare 100-year “century” bond, and Amazon sold roughly $37 billion across 11 tranches on March 10, a sale that drew orders worth close to four times the amount on offer, Reuters reported.
For a corner of finance that usually trades on whether a company can pay a 4% or 5% coupon for the next decade, that is a large amount of paper to absorb. Barclays expects total U.S. investment-grade corporate issuance to reach about $2.46 trillion in 2026, up 11.8% from 2025, with the increase driven mostly by non-financial borrowers. “The biggest upside risk is AI hyperscaler capex, which could require more jumbo public deals than typical,” the bank’s analysts wrote.
Why a downgrade hurts more than a default scare
Here is the asymmetry that worries Ware and her team. A stock can keep rising as long as a company keeps winning. A bond cannot. The best outcome for a bondholder is that the borrower pays the coupon and returns the principal, which is exactly what the price already assumes. The downside is real. If the spending needed to build AI infrastructure forces these companies to borrow more, rating agencies could start to question the top-tier grades that make the bonds look safe today. A downgrade would push the price down. As the outlook put it, a bond cannot rise in price indefinitely the way a stock can, but it can still lose value if the issuer is cut.
That is why the spread, the extra yield over Treasurys, matters so much. When it is thin, the buyer is taking on the chance of a downgrade for very little payment. Fidelity’s read is that the current spread does not cover it, particularly on the longest-dated bonds, where a downgrade would do the most damage.
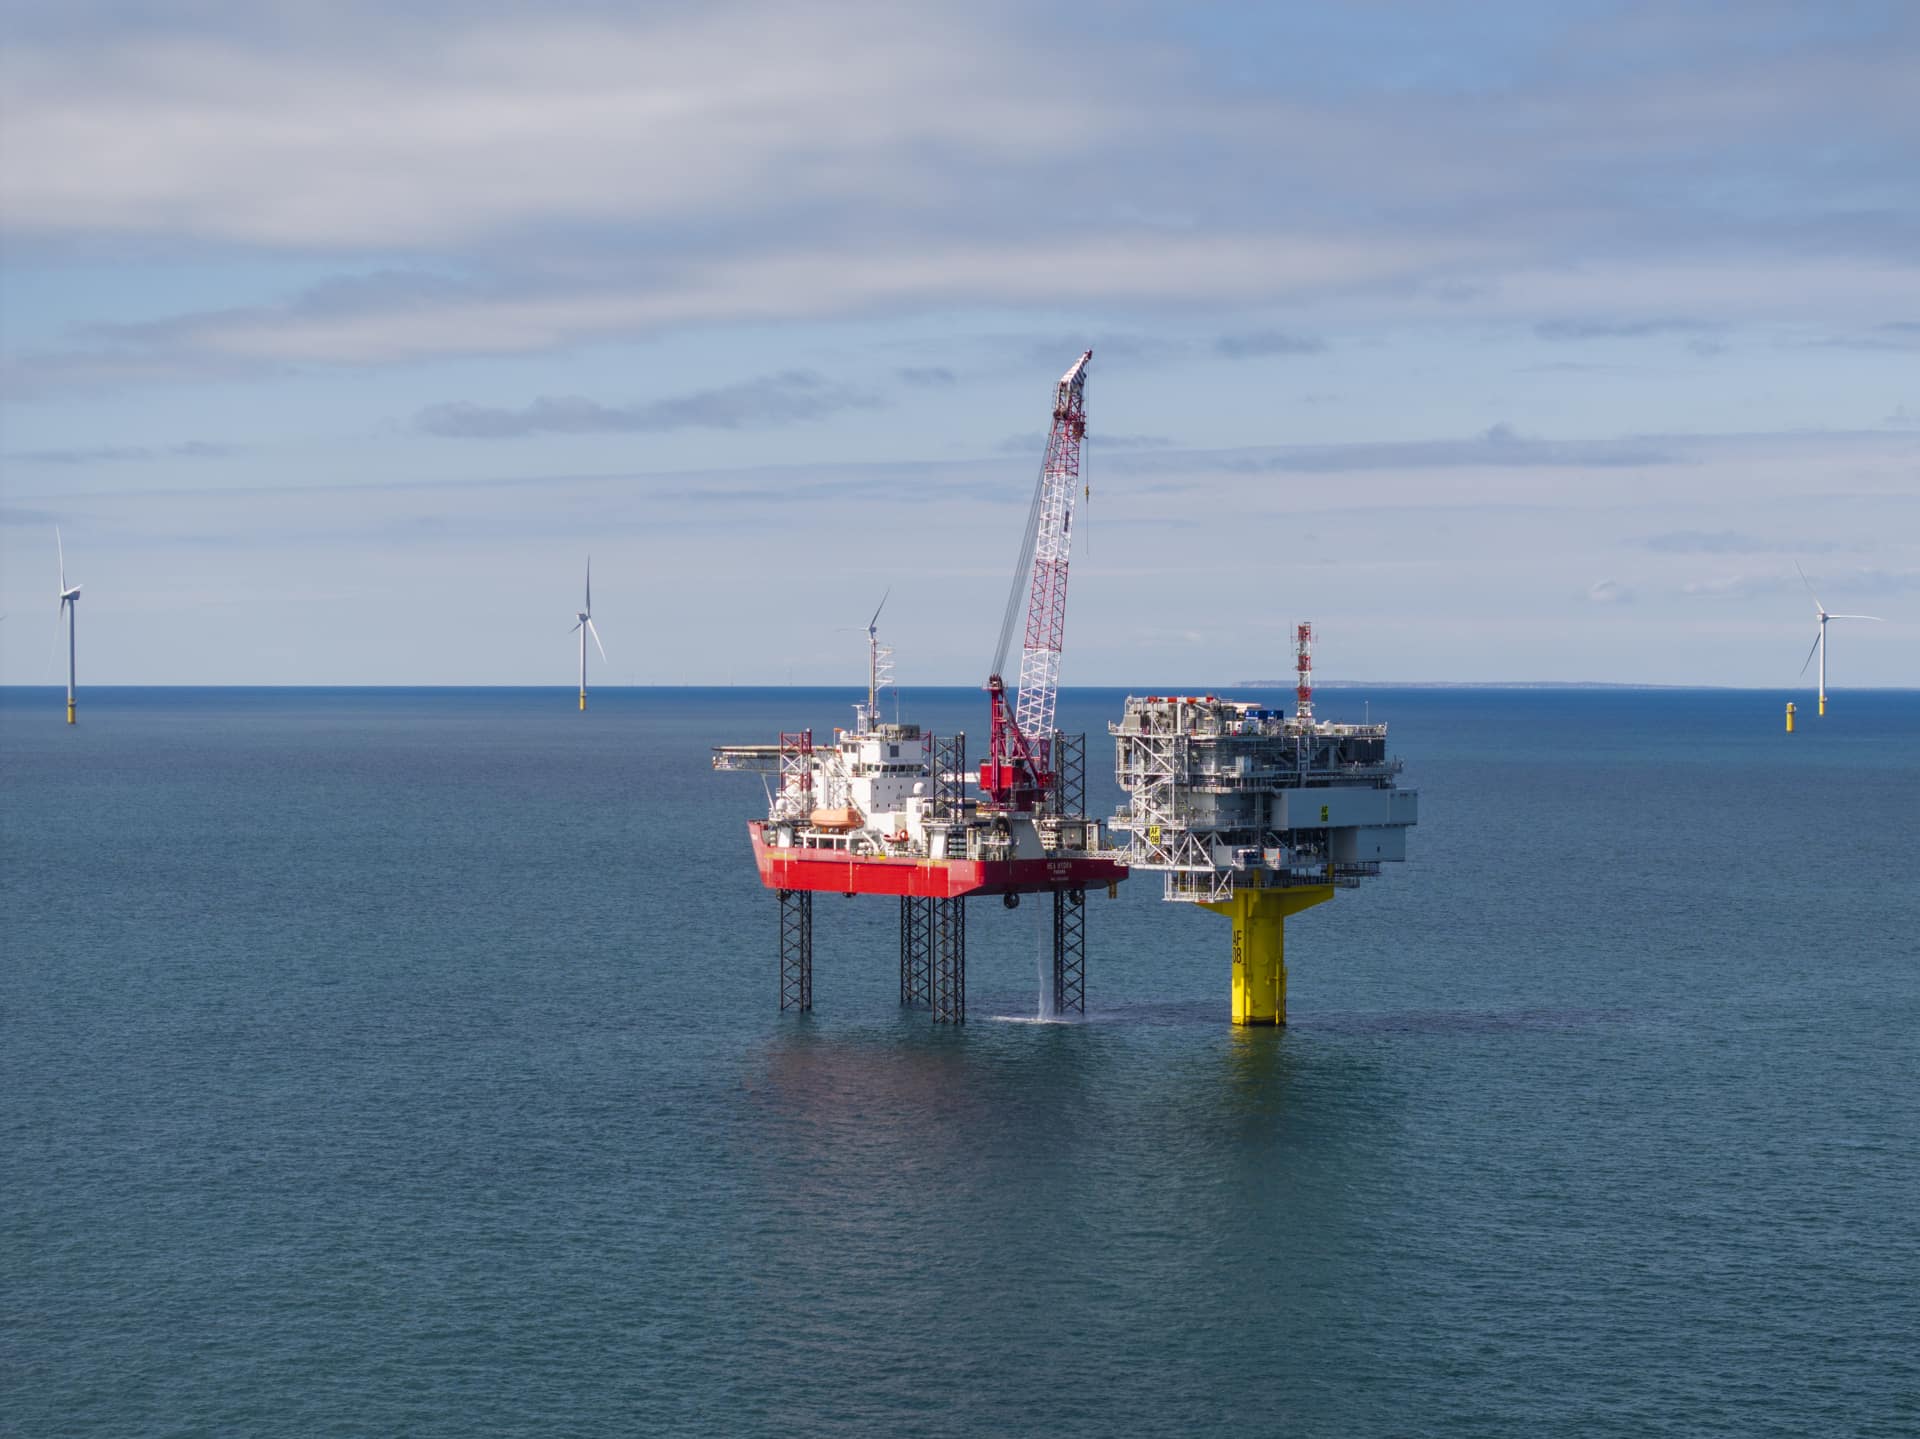
The caution is not limited to one fund company. Since the middle of 2025, the cost of insuring hyperscaler debt through credit default swaps has climbed, a sign that some investors are paying up for protection rather than trusting the ratings, Reuters reported. The borrowing is heavily long-dated, reflecting the multi-decade life the companies assign to their data centers, which loads more interest-rate sensitivity onto buyers at a time when the direction of rates is unsettled.
It would be easy to read all this as a warning about the companies themselves. It is not, at least not yet. Their balance sheets remain strong, and Fidelity is not forecasting a rise in defaults. The concern is narrower and, for bond investors, more immediate: a flood of supply priced for perfection in a market that gives buyers nothing extra for the risk they are taking.
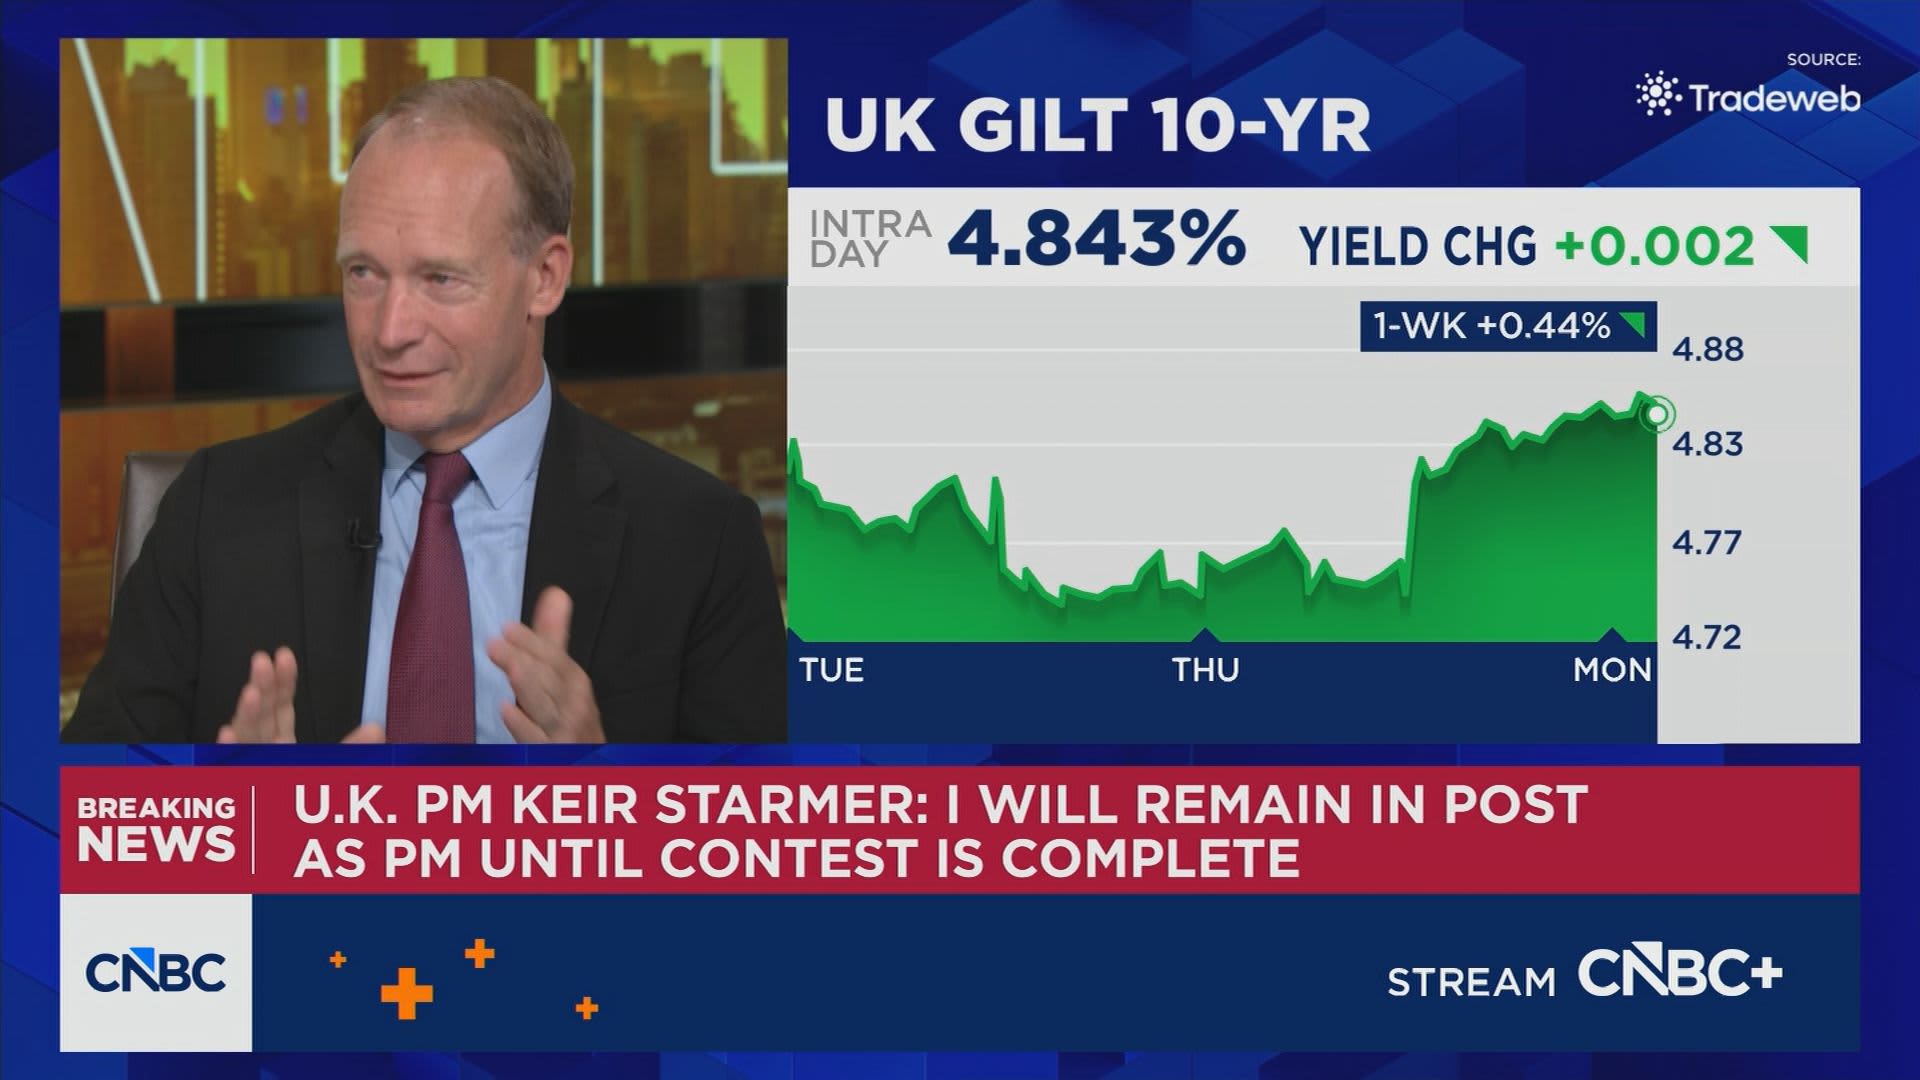
Where the money is going instead
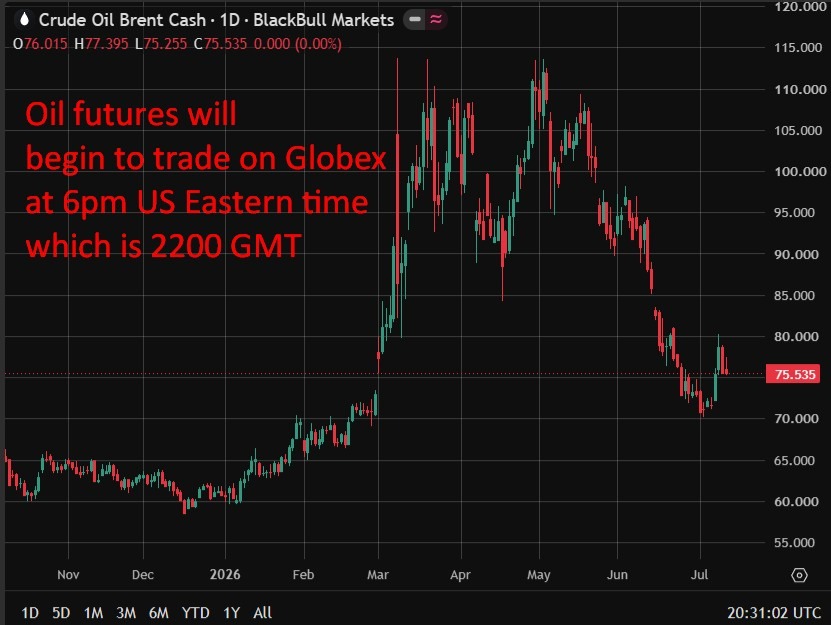
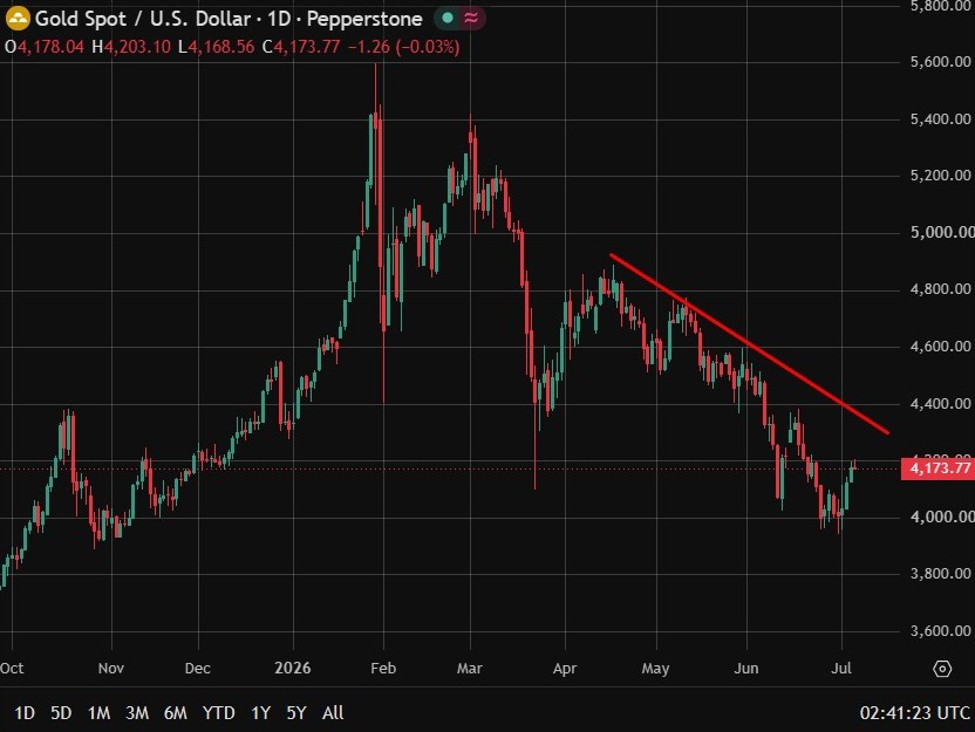
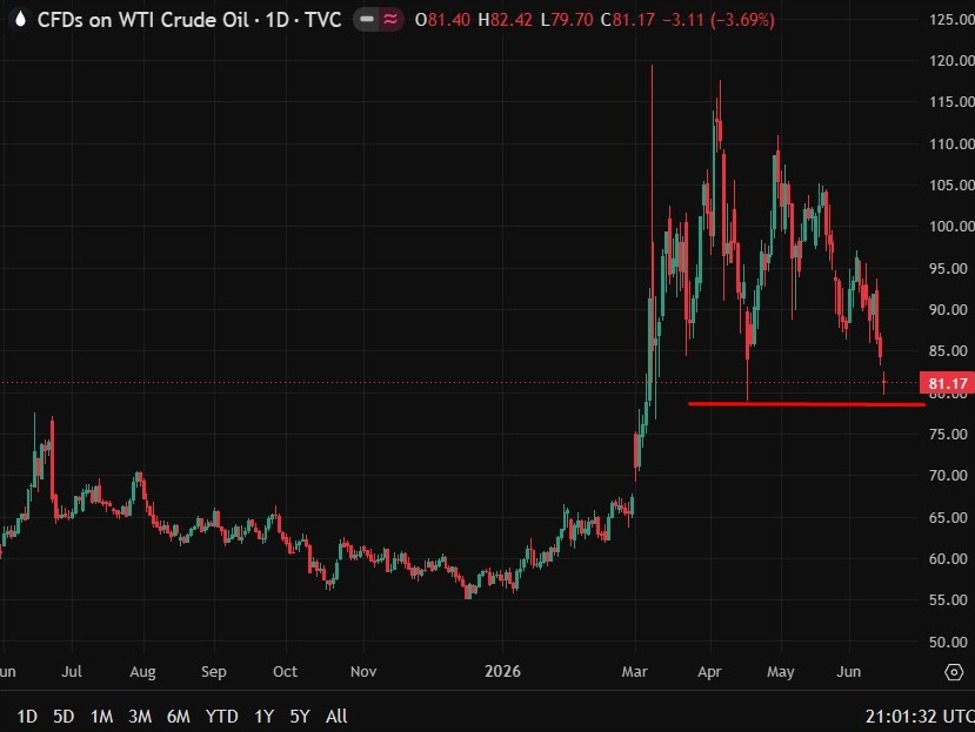
So where is Fidelity putting money instead? Ware said her team has been holding more Treasurys, which now yield more than they have in two decades and can be sold quickly if better opportunities appear. The 10-year Treasury rate climbed above 4.5% in mid-May and the 30-year above 5%, and investors have shifted from expecting two rate cuts this year to pricing in the possibility of a hike. The team has also been hunting in what the outlook called “less glamorous, and less easily understood, corners of the fixed income market,” including commercial mortgage-backed securities tied to a single property type, the AAA slices of certain collateralized loan obligations, and asset-backed securities supported by business franchise fees. These are markets where, in Ware’s words, an analyst can do the work at the property or deal level and find value the crowd has missed.
The irony is hard to miss. The same technology that has pulled record sums into the stock market is now testing the patience of the most conservative investors in finance. For bond buyers, the question raised by the AI build-out is not whether the machines will work. It is whether they are being paid to find out.