
Squidpy, Giotto, and Seurat are the three dominant spatial transcriptomics analysis toolkits, and the decision between them is the first architectural choice in any spatial bioinformatics workflow. The choice carries downstream consequences for data formats, available methods, visualization options, and community support. Your stack will be rooted in either Python or R, and the right answer depends less on which toolkit is “best” than on your data type, analysis goals, and team’s existing expertise.
Key takeaways
- Squidpy is an open-source Python framework for spatial omics analysis, built on Scanpy and AnnData, that provides spatial statistics, image feature extraction, and native integration with the scverse toolchain.
- Seurat v5, developed by the Satija Lab at the New York Genome Center, extends the most widely used single-cell R package with spatial analysis support for Visium, Xenium, and multiplexed error-robust fluorescence in situ hybridization (MERFISH) data, adding niche analysis and spot deconvolution.
- Giotto Suite is the most purpose-built R toolkit for spatial multiomics, providing a technology-agnostic data framework, Hidden Markov Random Field (HMRF)-based spatial domain detection, and native 3D data support not found in the other two toolkits by default.
- All three toolkits read data from major commercial spatial platforms, but they differ substantially in their spatial statistics modules, visualization approaches, and community ecosystems.
- Language environment and existing workflows are the most practical starting point for toolkit selection; switching between Python and R ecosystems mid-project carries a significant refactoring cost.
Python vs R for spatial analysis: understanding the toolkit divide
The choice between spatial analysis toolkits divides along language lines: Squidpy for Python users, Seurat and Giotto Suite for R users. This is not merely an aesthetic preference: the language chosen at the start of a project determines which preprocessing pipelines integrate naturally, which visualization tools are available without reformatting, and which broader community extensions are accessible.
On the Python side, Squidpy operates as part of the scverse ecosystem, building directly on Scanpy for gene expression analysis and AnnData for data storage. On the R side, Seurat and Giotto occupy the spatial analysis space with substantially different designs. A team already using Scanpy for single-cell RNA sequencing (scRNA-seq) analysis will find Squidpy a natural extension of existing code. A group running Seurat-based scRNA-seq workflows will reach for Seurat’s spatial vignettes before evaluating alternatives. Giotto Suite occupies a distinct position: it was designed from the ground up for spatial data and carries fewer assumptions inherited from the single-cell world, making it worth evaluating even for teams already using Seurat.
The broader computational context (data format choices, preprocessing pipelines, and the full analytical spectrum from raw counts to biological interpretation) is covered in the companion guide to spatial data analysis workflows. For the foundational science and platform landscape, the spatial biology methods guide covers the full range from imaging-based to sequencing-based approaches.
Squidpy and the Scanpy ecosystem for spatial omics
Squidpy is an open-source Python toolkit for spatial omics analysis that builds on the Scanpy single-cell framework and the AnnData data format, providing a unified environment for spatial statistics, image analysis, and interactive visualization. Palla, Spitzer, and colleagues from the Theis laboratory developed Squidpy as a scalable spatial omics framework. Because it is built on Scanpy’s single-cell analysis toolkit and AnnData, it stores spatial coordinates, gene expression, and image data within a single object structure, adding a spatial neighbor graph that encodes the geometric relationships between cells or spots.
The Squidpy analysis module covers several interconnected analytical areas. Spatial statistics include Moran’s I for spatial autocorrelation, Ripley’s statistics for point-pattern analysis, co-occurrence scores for cell-type proximity, and neighborhood enrichment tests that assess whether cell types cluster together beyond chance. These functions operate directly on the spatial neighbor graph and are ready immediately after standard preprocessing. Squidpy also includes native ligand-receptor interaction analysis, enabling cell-cell communication inference within the same data object.
Squidpy’s image analysis module is its most distinctive capability relative to Seurat and Giotto. Designed for tissues imaged alongside molecular readouts (as is standard with platforms such as 10x Genomics Visium), the module extracts morphological features from high-resolution tissue images, including texture statistics and segment-level properties, and stores them in the same AnnData object alongside expression data. Visualization is handled through napari-spatialdata, an interactive Napari plugin that replaced Squidpy’s earlier built-in visualization tool and supports high-resolution image exploration with spatial overlays.
The scverse community has also developed SpatialData, an open and universal data framework for spatial omics, which Squidpy is progressively integrating with. This positions the Python spatial analysis stack favorably for future-proofing: as imaging-based platforms generate richer multimodal outputs, the scverse toolchain absorbs them without requiring format migration. Squidpy’s main limitation is documentation depth for less common analyses: the core functions are well-documented, but researchers working with custom data formats or non-standard workflows will encounter a smaller base of community-generated tutorials than is available in the Seurat ecosystem.
Seurat v5 for spatial analysis: capabilities, platforms, and trade-offs
Seurat is the most widely used toolkit in single-cell genomics, and Seurat v5 extends this foundation to spatial transcriptomics analysis. The version 5 release, introduced by Hao and colleagues at the Satija Lab to enable integrative multimodal single-cell analysis, added dedicated spatial workflows to what was already the dominant R package for scRNA-seq. For researchers who have already run scRNA-seq analyses in Seurat, the transition to spatial data requires loading a new data type rather than learning an entirely new framework.
Loading spatial data in Seurat uses the Load10X_Spatial() function for Visium experiments, and version 5 added dedicated handling for imaging-based platforms including Xenium, MERFISH, and CosMx via the LoadNanostring() function. The Seurat object stores the spatial assay alongside standard gene expression assays, so dimensionality reduction, clustering, marker identification, and integration pipelines carry over directly from scRNA-seq workflows.
Two spatial-specific features in Seurat v5 are especially useful. The first is niche analysis: a method that defines tissue regions by their local cell-type composition, assigning each cell a neighborhood identity rather than an intrinsic expression cluster. This allows Seurat users to detect tissue compartments directly from spatial context without requiring expression-based clustering as a proxy. The second is native support for Robust Cell Type Decomposition (RCTD) for spot-based deconvolution, a method that infers cell-type proportions within multi-cell spots using a single-cell reference, which is critical for Visium data where each captured spot typically contains several cells.
Seurat’s community infrastructure is unmatched among the three toolkits. The Satija Lab publishes detailed vignettes for each major spatial platform, the package is routinely used in bioinformatics workshops and university courses as the default introduction to single-cell methods, and troubleshooting resources are abundant. The key trade-off is architectural: Seurat’s spatial features were grafted onto a single-cell framework rather than built for spatial data natively, which can show in how spatial context is handled compared with purpose-built tools like Giotto Suite.
Giotto Suite’s feature set: purpose-built for spatial multiomics
Giotto Suite is an R toolkit designed from the ground up for spatial multiomics analysis, distinguishing it from both Seurat and Squidpy, which adapted single-cell frameworks to spatial data. Dries, Zhu, and colleagues from the Yuan laboratory built the original Giotto as an integrative spatial expression toolbox. Chen, Chávez-Fuentes, and colleagues then developed Giotto Suite as a multiscale spatial multiomics ecosystem, representing a substantial rearchitecting of the original package around a technology-agnostic data framework.
The defining design decision in Giotto Suite is its data object. Rather than extending an existing single-cell format, the developers built a bespoke R framework that explicitly encodes molecular, morphological, spatial, and annotated feature information within a single object. This makes the Giotto object natively spatial in a way that retrofitted formats are not, and it allows the same framework to accommodate spot-based data (Visium), single-cell resolution data (Xenium, MERSCOPE), subcellular transcript locations, and 3D volumetric datasets without format conversion.
Giotto Suite’s analytical strengths include capabilities not available by default in Squidpy or Seurat. HMRF analysis is a probabilistic graphical model that detects spatial domains by jointly considering each cell’s intrinsic gene expression and the domain states of its spatial neighbors, offering a principled alternative to cluster-then-project approaches. Spatial variable gene detection employs a range of statistical tests, and enrichment analysis integrates single-cell references for cell-type deconvolution. Giotto Suite also provides built-in bidirectional converter functionality for Python AnnData, SpatialData, and Seurat objects, making interoperability with external tools more seamless than in most spatial packages.
Visualization in Giotto Suite is handled through a built-in Shiny application for interactive exploration alongside ggplot2-based static plots. The Shiny interface provides a browser-accessible environment for cell-type overlays, gene expression maps, and cluster visualization. For very large datasets, a VitessceR export function enables compatibility with the Vitessce spatial visualization framework. The trade-off is a steeper learning curve: Giotto’s data framework introduces conventions that do not map directly onto AnnData or the Seurat object, and analysts transitioning from either ecosystem will need time to internalize the package’s object structure and syntax.
Table 1: Feature comparison of Squidpy, Seurat v5, and Giotto Suite for spatial transcriptomics analysis.
|
Feature |
Squidpy |
Seurat v5 |
Giotto Suite |
|
Language |
Python |
R |
R |
|
Data format |
AnnData (scverse) |
Seurat object |
Giotto object |
|
Key publication |
|||
|
Platform support |
Visium, Xenium, MERSCOPE, Slide-seq |
Visium, Xenium, MERFISH, CosMx |
Spot-based, single-cell, subcellular, 3D |
|
Spatial statistics |
Neighborhood enrichment, Moran’s I, co-occurrence, Ripley’s |
Niche analysis, RCTD deconvolution |
HMRF, enrichment, spatial variable genes |
|
Image analysis |
Yes (morphological feature extraction) |
Limited |
Limited |
|
Visualization |
napari-spatialdata (interactive) |
ggplot2-based, SpatialDimPlot |
Shiny app, ggplot2, VitessceR export |
|
Community size |
Growing (scverse ecosystem) |
Very large (dominant single-cell R package) |
Moderate (spatial-focused) |
|
Best for |
Python-first labs, image-heavy data, scverse integration |
Seurat-based scRNA-seq teams, familiar workflows |
Purpose-built spatial analysis, 3D data, HMRF domain detection |

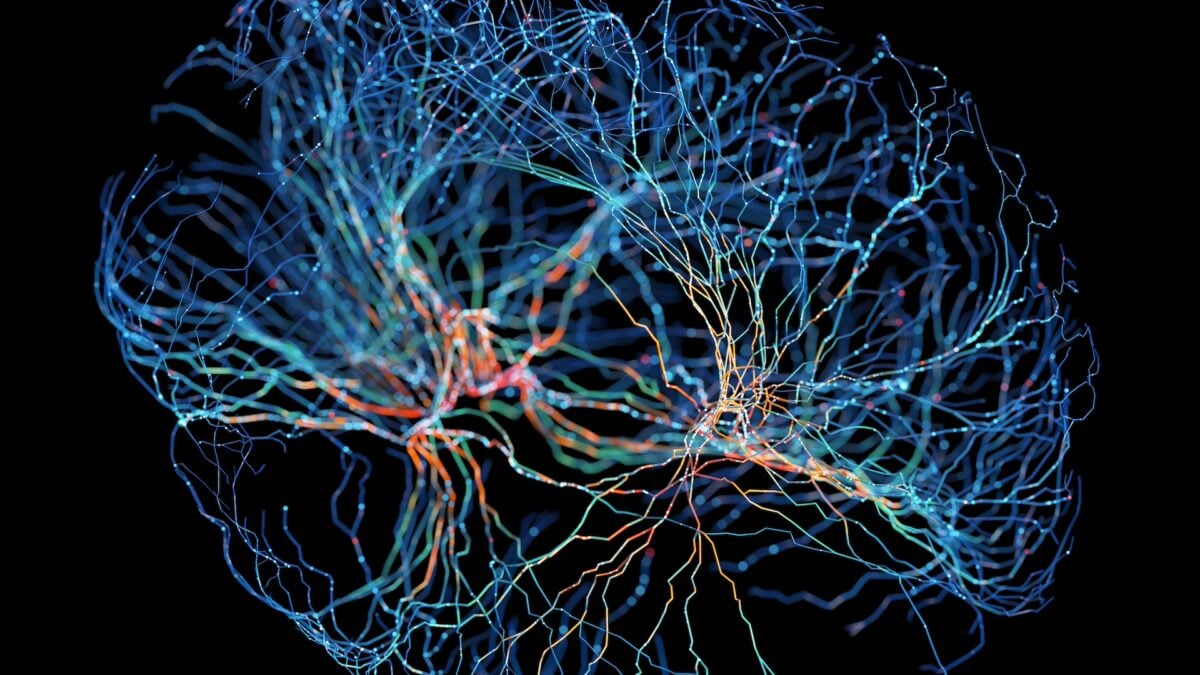
Figure 1: Core features of Squidpy, Seurat v5, and
Giotto Suite organized by language ecosystem and analytical capability. Credit:
AI-generated image created using Google Gemini (2026).
How to choose between Squidpy, Seurat, and Giotto for spatial analysis
Choosing among Squidpy, Seurat, and Giotto Suite is less a question of raw capability than of fit: to your language environment, data type, and the specific analysis questions your project demands. The three toolkits have overlapping coverage across major platforms and core analyses, but each has a domain where it leads. The following decision framework maps the most important selection criteria:
- Identify your primary language environment. If your team writes Python and uses Scanpy for scRNA-seq, Squidpy is the natural choice and requires no ecosystem change. If your team works in R and already has Seurat objects from prior single-cell projects, Seurat v5 imposes the smallest transition cost. If you are starting a new R-based project with no prior toolkit commitment, Giotto Suite warrants serious evaluation.
- Consider your platform’s output format. Visium data from 10x Genomics Space Ranger is natively loaded by all three toolkits, but imaging-based data from Xenium, MERSCOPE, or CosMx has the most mature support in Squidpy and Seurat v5. Giotto Suite supports these platforms but through its own import framework.
- Assess whether spatial domain detection is central. If your questions require HMRF-based spatial domains or a purpose-built spatial data framework that natively handles 3D datasets, Giotto Suite offers capabilities that Squidpy and Seurat do not provide by default.
- Factor in image analysis requirements. Squidpy’s image module is the only one of the three that extracts morphological features from whole-tissue images as part of the standard workflow, making it the strongest choice for projects that combine spatial transcriptomics with histological image data.
- Check your downstream analysis plan. Ligand-receptor analysis and spatial neighborhood statistics are covered by all three toolkits, but Squidpy’s implementation is native and tightly integrated; in Seurat and Giotto, these analyses typically rely on companion packages. This is explored in depth in the companion article on cell-cell communication and neighborhood analysis in spatial data.
Whichever toolkit is selected, the choice is not irreversible. AnnData and Seurat objects interconvert via the h5ad file format, and Giotto Suite provides built-in bidirectional converters for both AnnData and Seurat objects. The real cost of switching is analytical rather than technical: methods behave differently across frameworks, defaults vary, and reproducing results requires careful parameter matching. The largest published spatial datasets, including those from consortia such as the Human BioMolecular Atlas Program and the Human Tumor Atlas Network, are increasingly distributed with multi-framework tutorials, which makes cross-platform validation more tractable than it was in earlier years of the field. The practical advice for new projects remains consistent: start with the toolkit that matches your existing ecosystem, and revisit the framework choice only when a specific analytical capability justifies the cost of migration.
This content includes text that has been created with the assistance of generative AI and has undergone editorial review before publishing. Technology Networks’ AI policy can be found here.