Hyperliquid (HYPE) rebounds slightly, trading above $55 on Thursday after finding support around the key support zone the previous day. Improving derivatives metrics, along with a constructive technical outlook, suggest a near-term recovery.
Derivatives metrics support a recovery in HYPE
CoinGlass funding rates data for HYPE shows a positive rate on Thursday, reading 0.006%, indicating that longs are paying the shorts and supporting a bullish outlook.
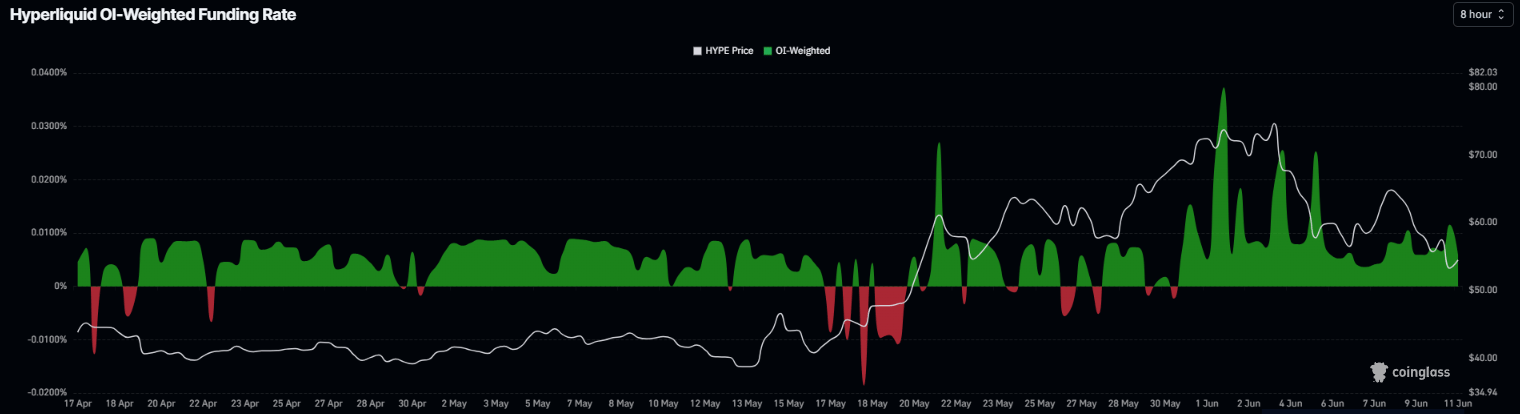
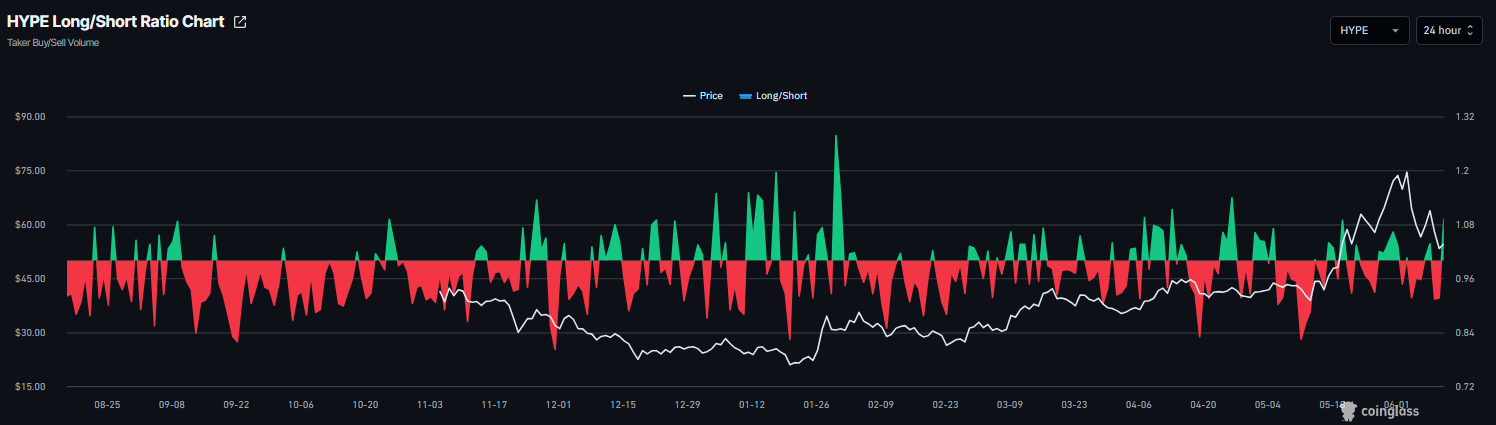
In addition to the positive rates, the bullish bets among the traders are also increasing. The long-to-short ratio for HYPE reads 1.09 on Thursday, nearing the highest level of the month.
Institutional demand shows signs of optimism
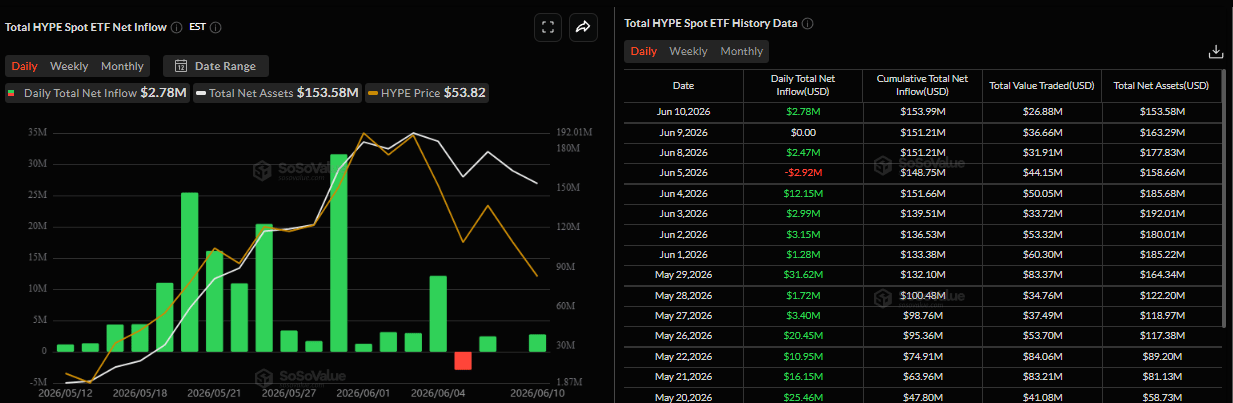
SoSoValue data shows that HYPE spot Exchange Traded Funds (ETFs) recorded an inflow of $2.78 million on Wednesday, marking the second positive flow so far this week. If this inflow trend continues and intensifies, HYPE’s price could recover.
Some signs of concerns
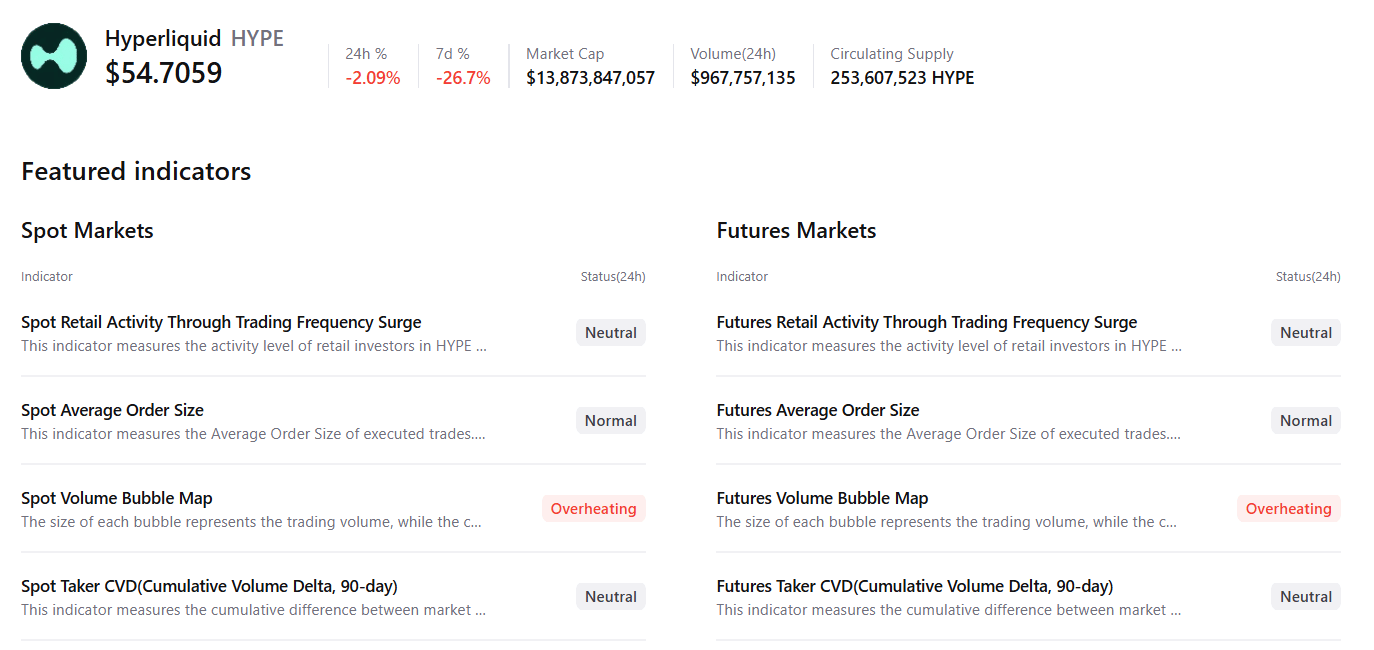
CryptoQuant’s summary data show some signs of concern for HYPE. Spot and futures markets show overheating, while other metrics remain neutral, which could cap HYPE’s potential recovery.
Hyperliquid Price Forecast: HYPE rebounds from key support
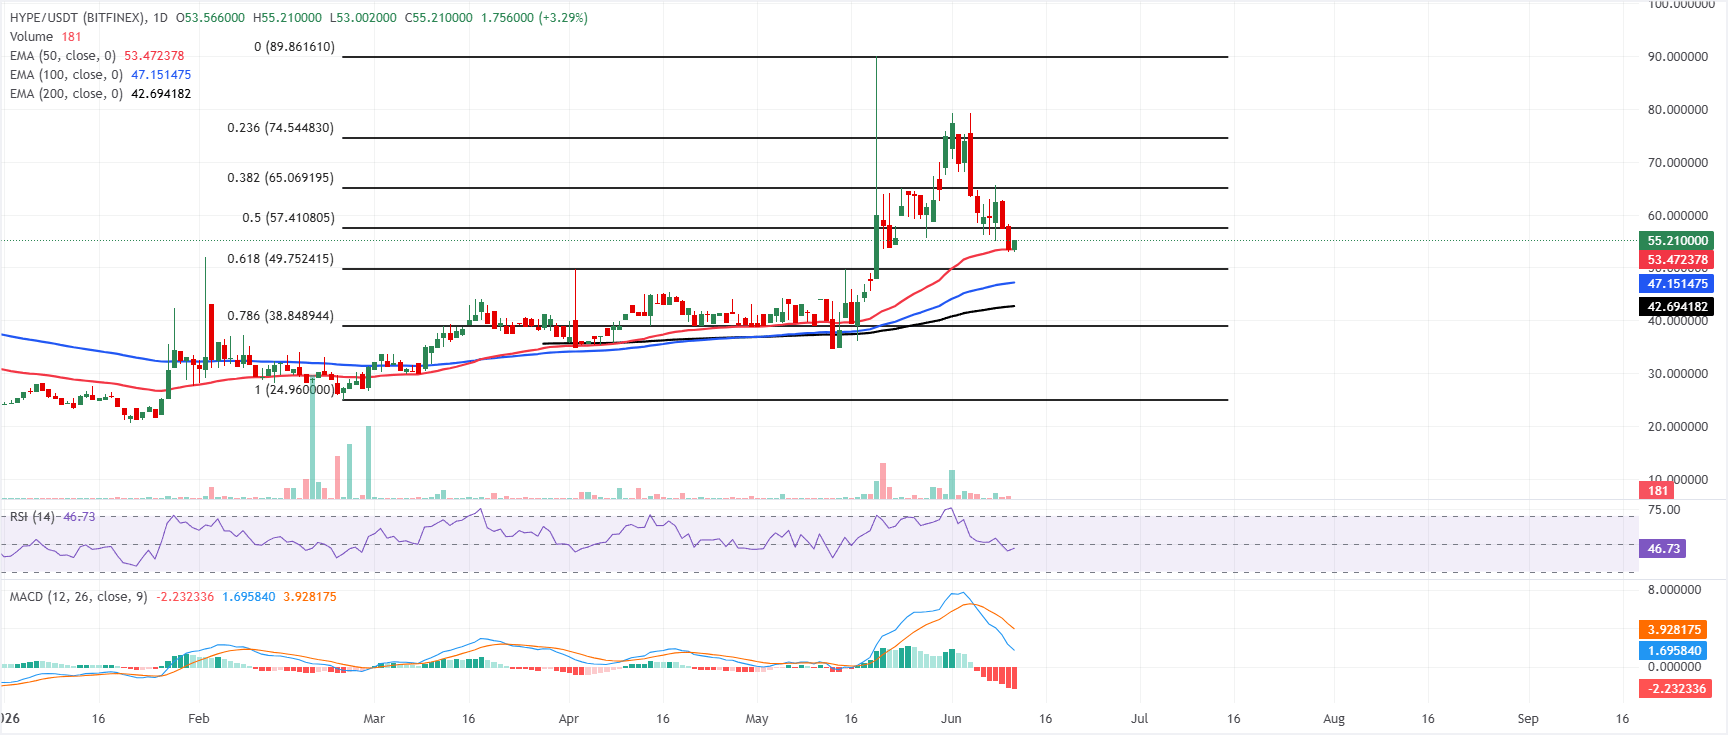
Hyperliquid price trades at $55.21, holding a broadly constructive bias while consolidating above a rising set of Exponential Moving Averages (EMAs). The 50-day EMA at $53.47, together with the 100-day EMA at $47.15 and the 200-day EMA at $42.69, underpins the broader uptrend and suggests dips are being absorbed ahead of those levels.
Momentum has cooled, with the Relative Strength Index (RSI) on the daily chart hovering near a neutral 46 and the Moving Average Convergence Divergence (MACD) remaining in negative territory, suggesting the market is in a corrective phase rather than a full trend reversal for now.
On the topside, initial resistance is aligned with the 50% retracement of the latest swing at $57.41, where a daily close higher would open the way toward the 38.2% Fibonacci retracement at $65.07, and then the 23.6% Fibonacci retracement level at $74.54.
On the downside, immediate support is seen at the 50-day EMA at $53.47, with a deeper pullback exposing the 61.8% Fibonacci retracement at $449.75, followed by the 100-day EMA at $47.15 and the 200-day EMA at $42.69, which would serve as stronger structural demand if selling pressure accelerates.
(The technical analysis of this story was written with the help of an AI tool.)