Jun 22, 2026
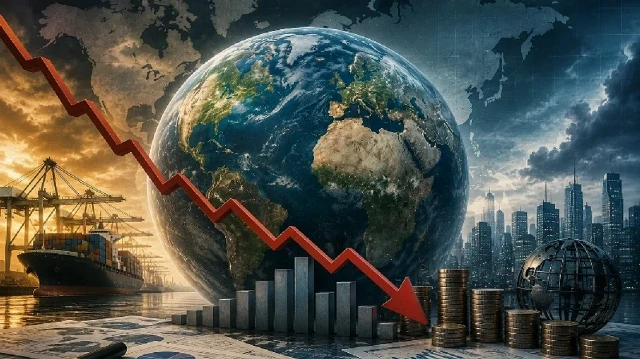
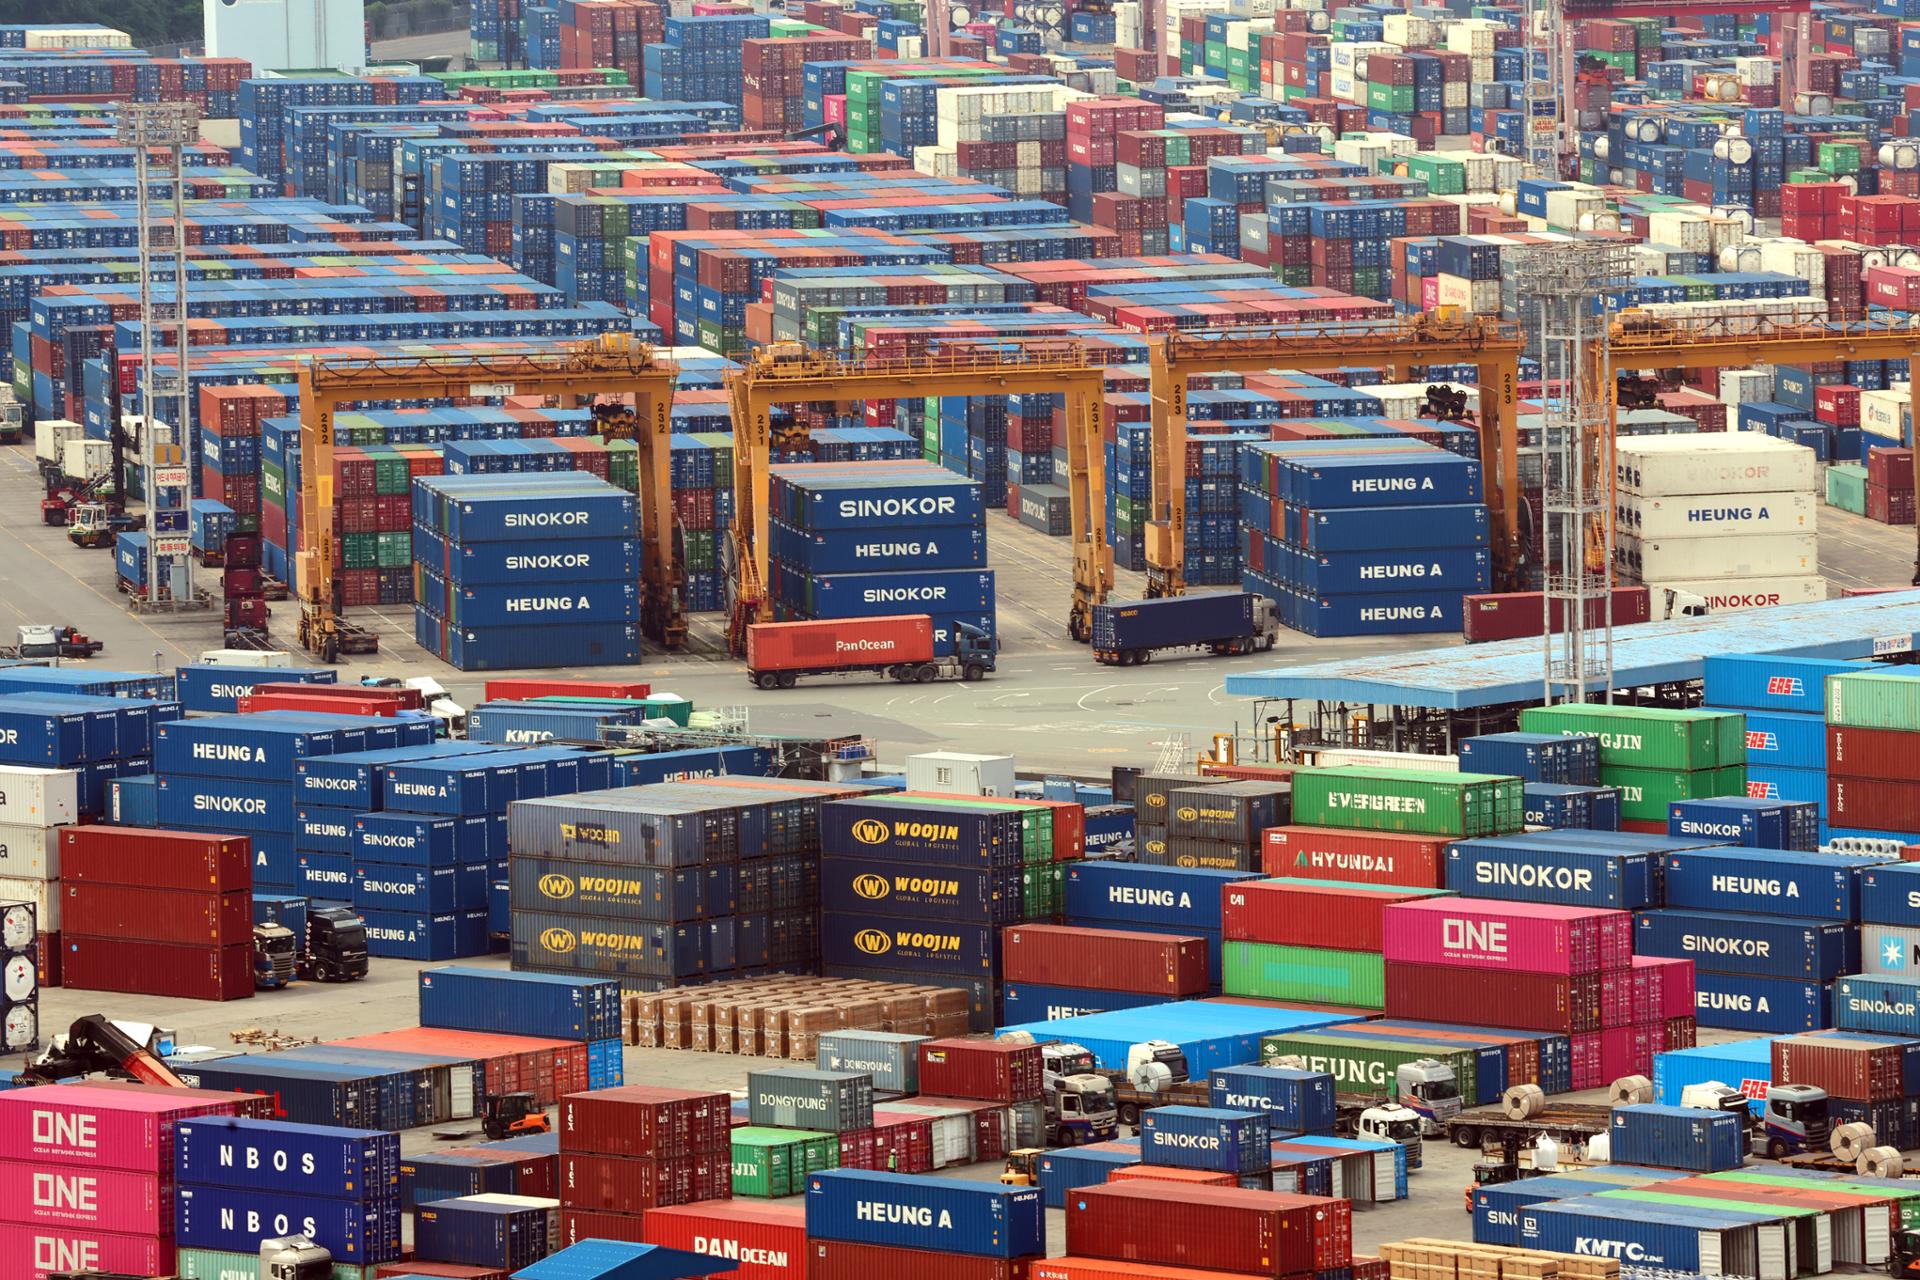
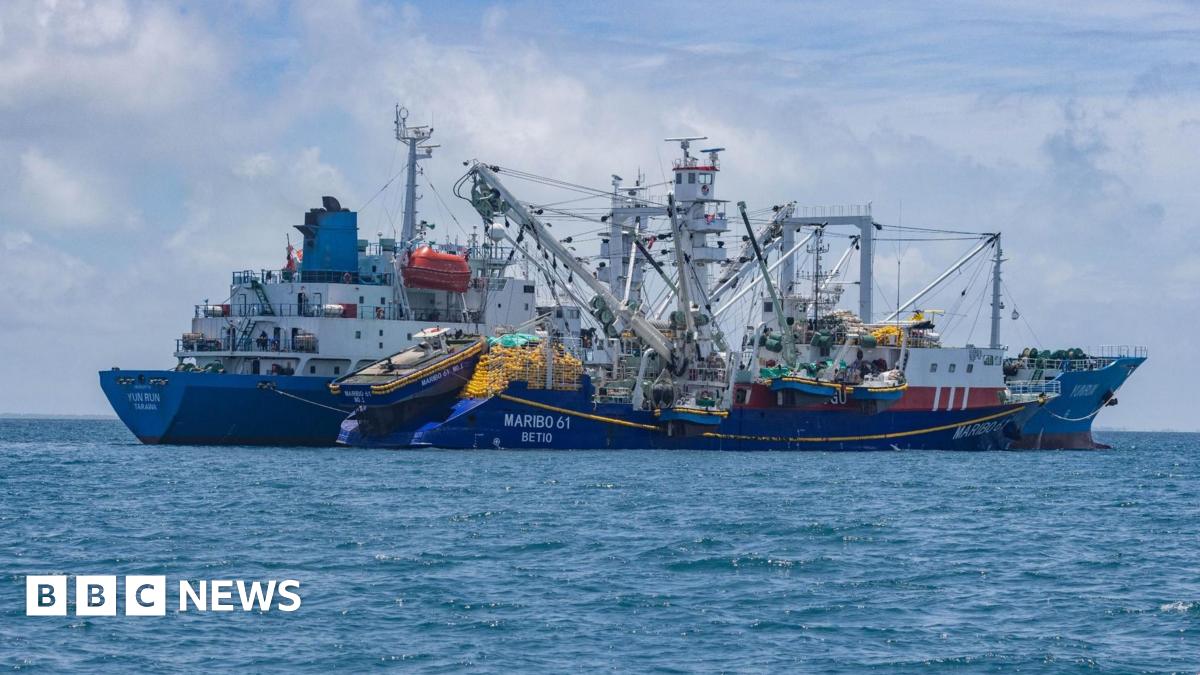
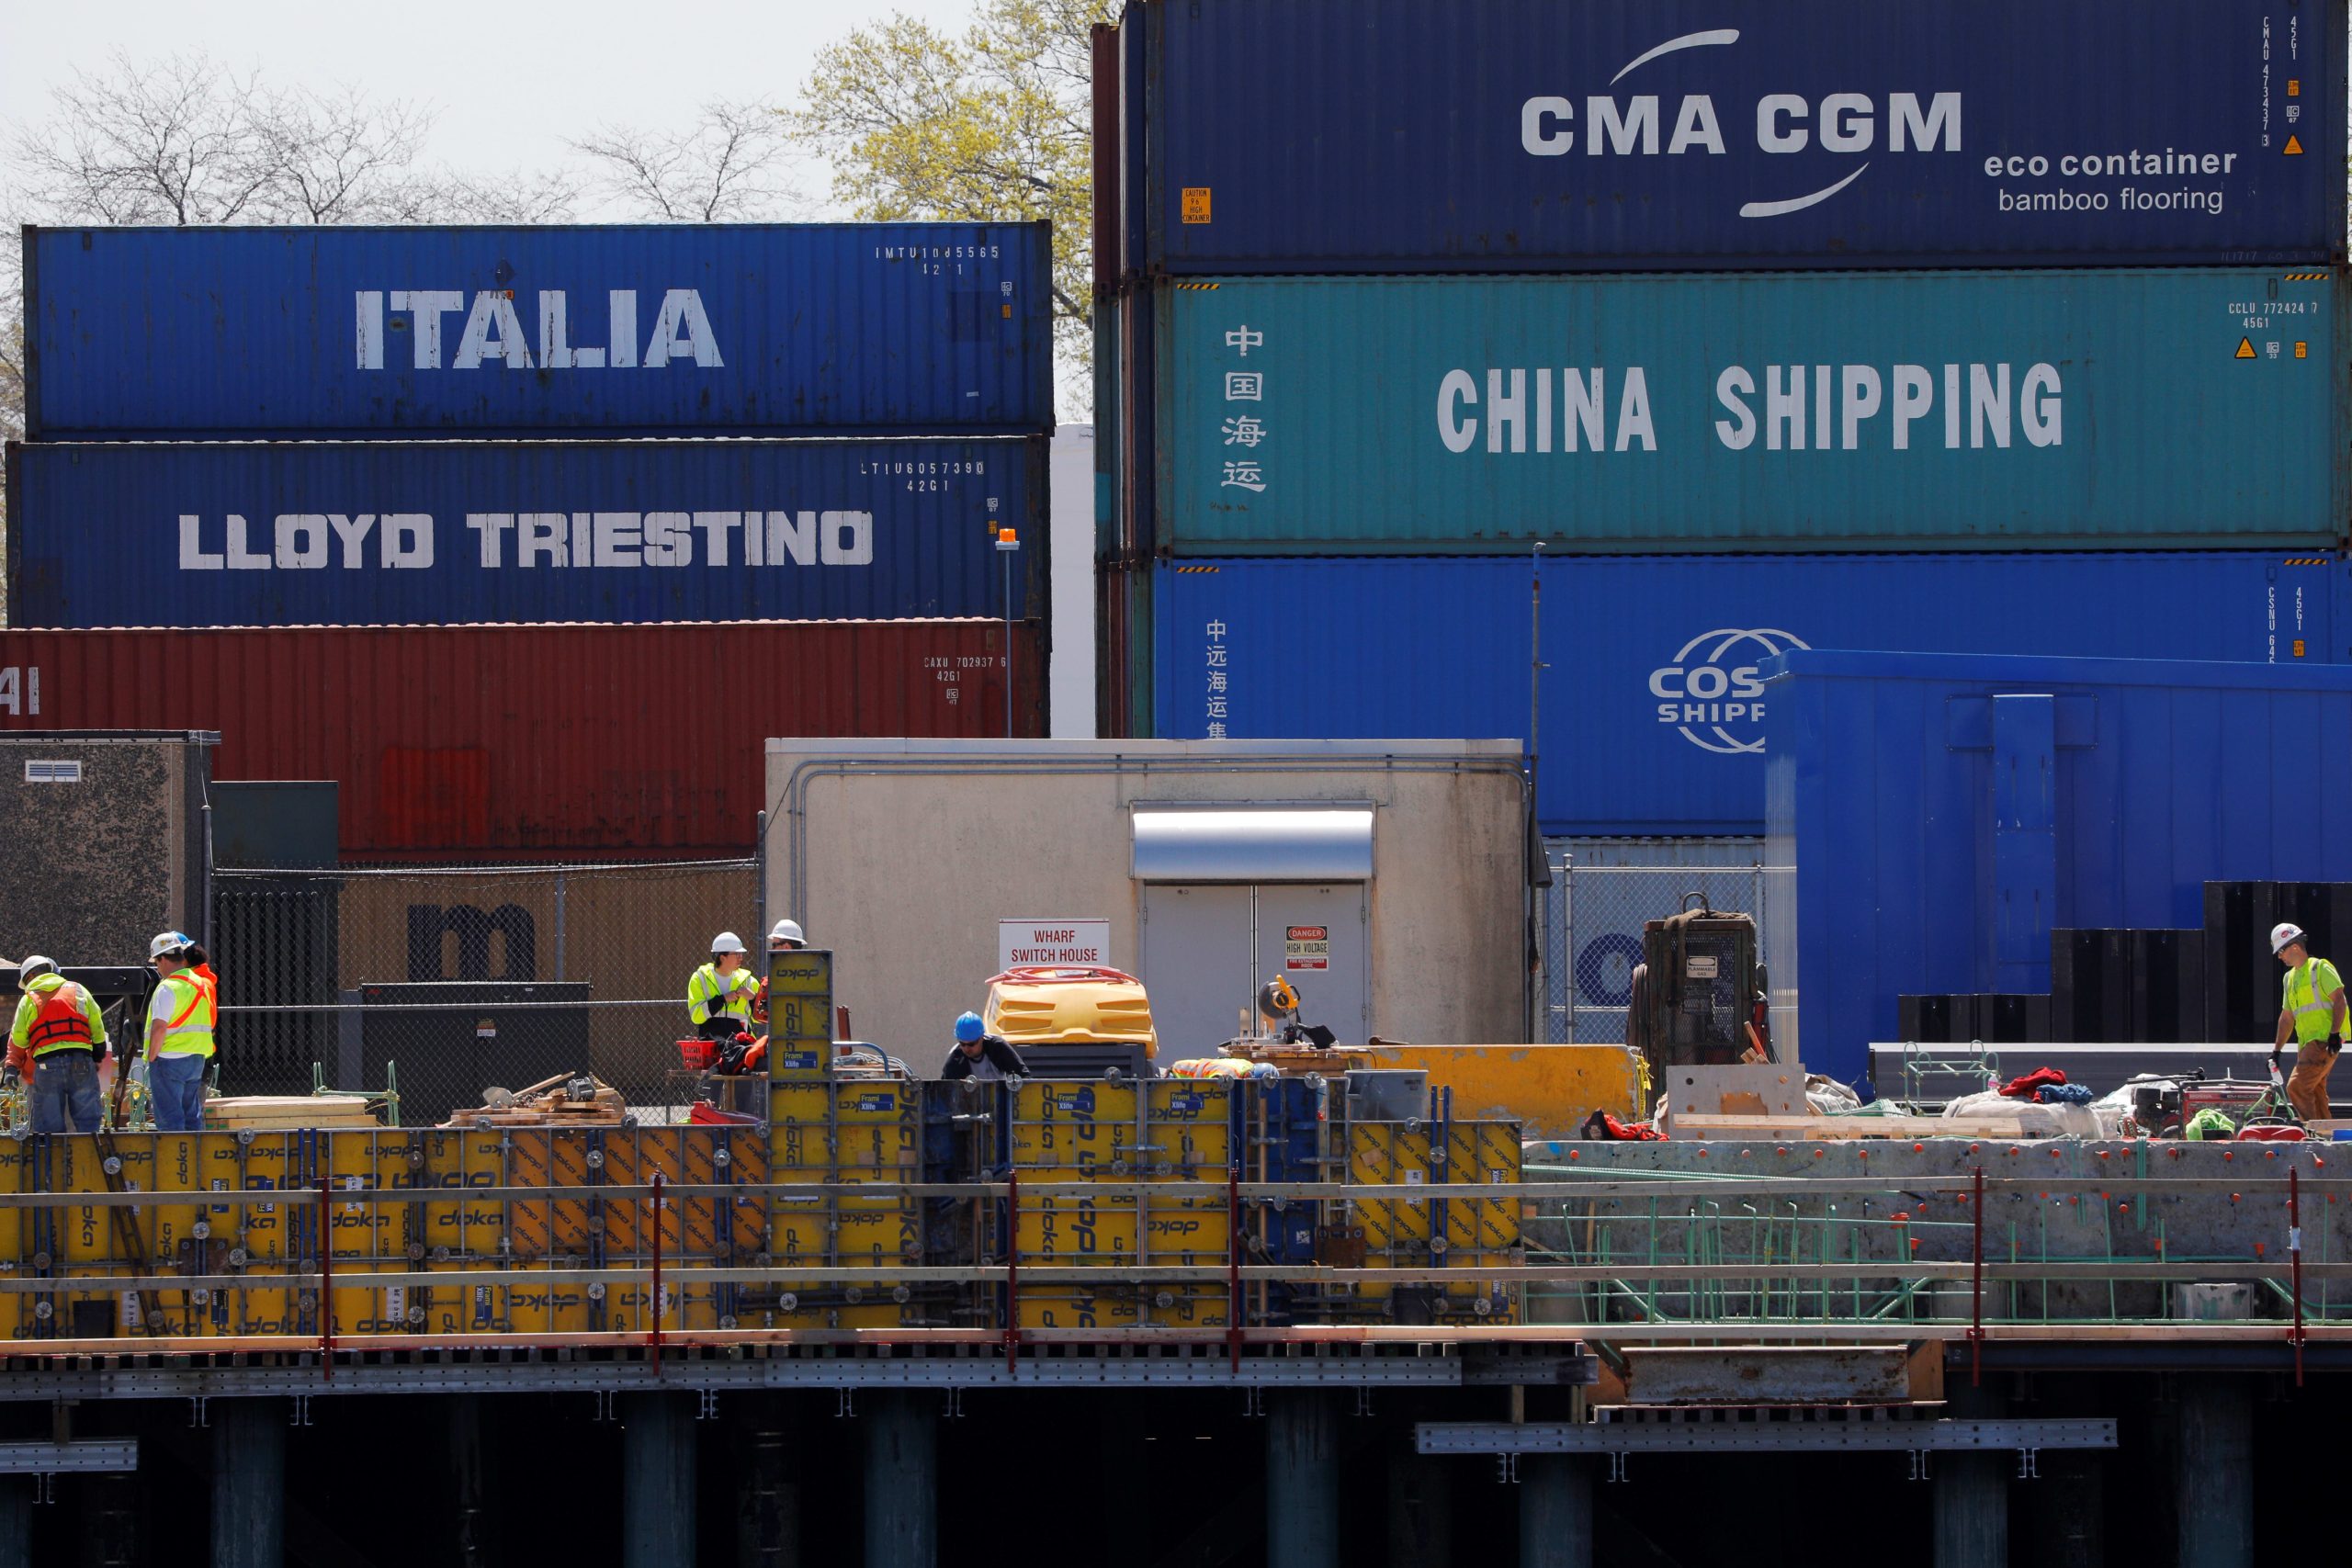
A recent peace deal between the United States and Iran is expected to provide significant relief for Asia, according to a report from ING. The agreement addresses the region’s heavy dependence on imported energy and its vulnerability to disruptions in Middle Eastern shipping routes.
Supply Relief and Sentiment Boost
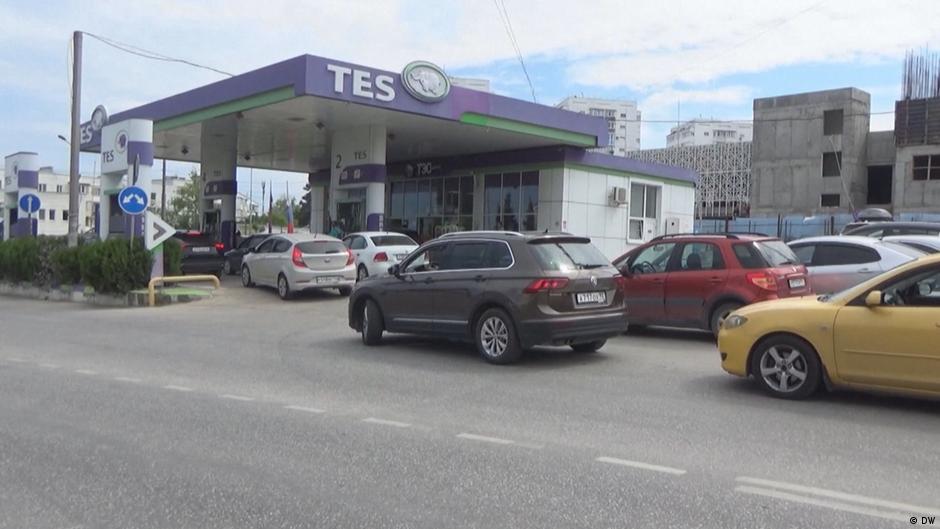
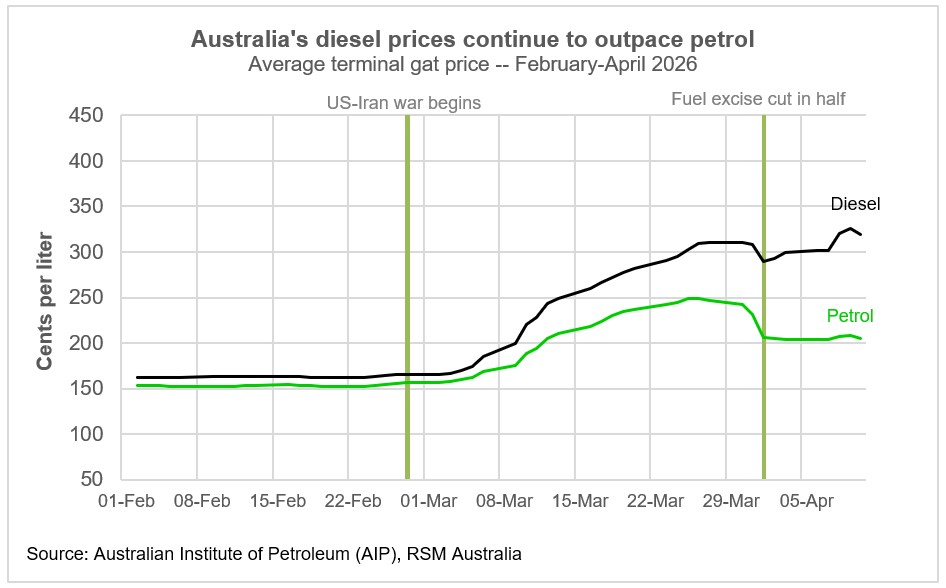
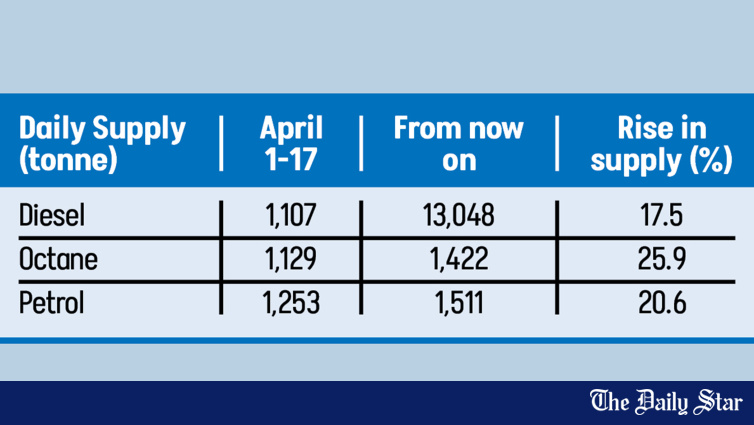
The report indicates that a partial restoration of oil flows through the Strait of Hormuz, with around 50% resuming by the end of June, should ease tightness in physical markets and reduce precautionary inventory hoarding. This is likely to support a rebound in consumer and business sentiment, particularly in countries where recent supply uncertainties had weighed on confidence.
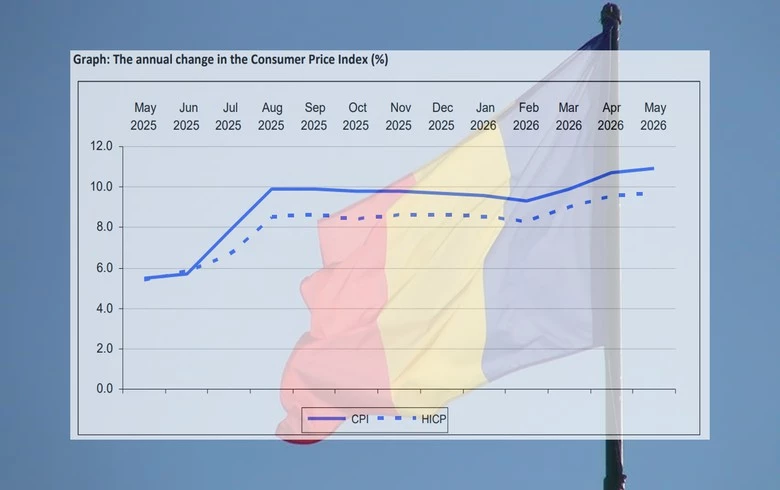
Disinflation Across Asia
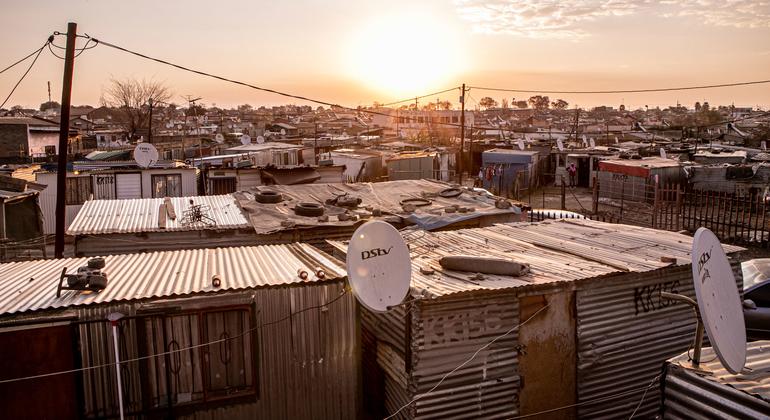
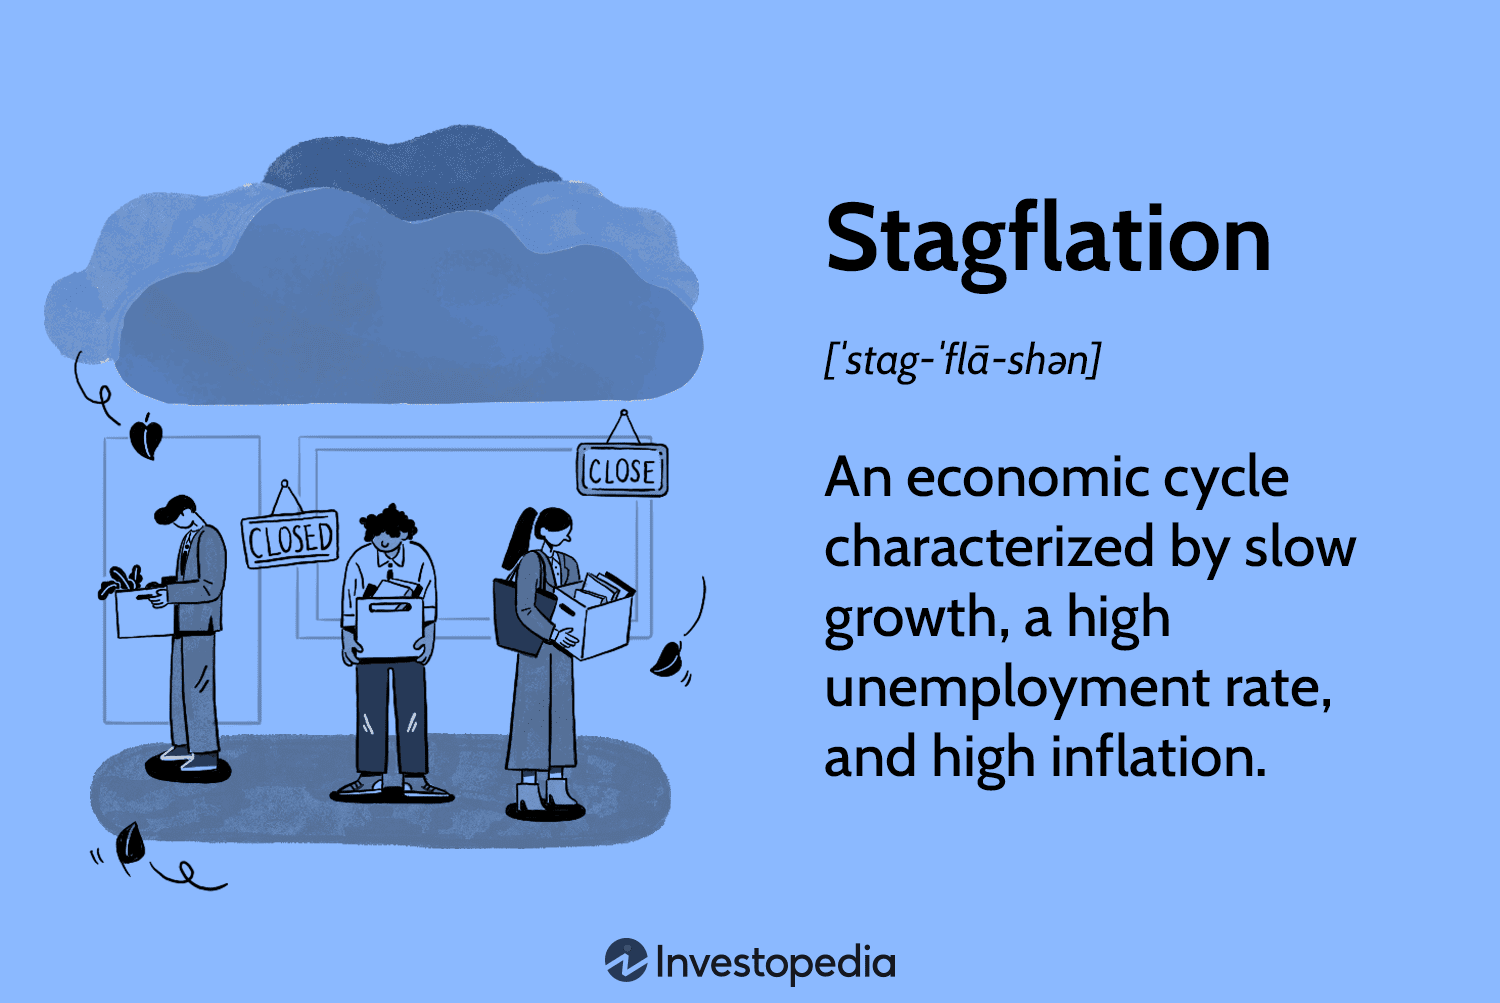
Lower oil prices are seen as crucial for easing inflation pressures across Asia, especially through food and fuel channels. The Philippines, which has experienced the sharpest rise in the contribution of food and fuel to inflation, is expected to be among the biggest beneficiaries of a sustained decline in oil prices. Economies with high import intensity, such as India and Thailand, are also likely to see meaningful relief as lower energy costs feed through into transport and food distribution.
Gradual Normalisation for Input Costs
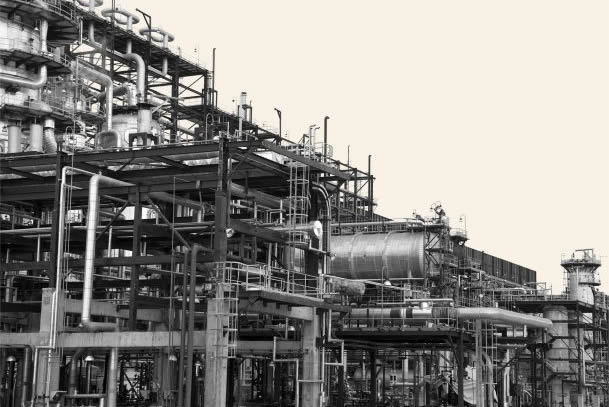
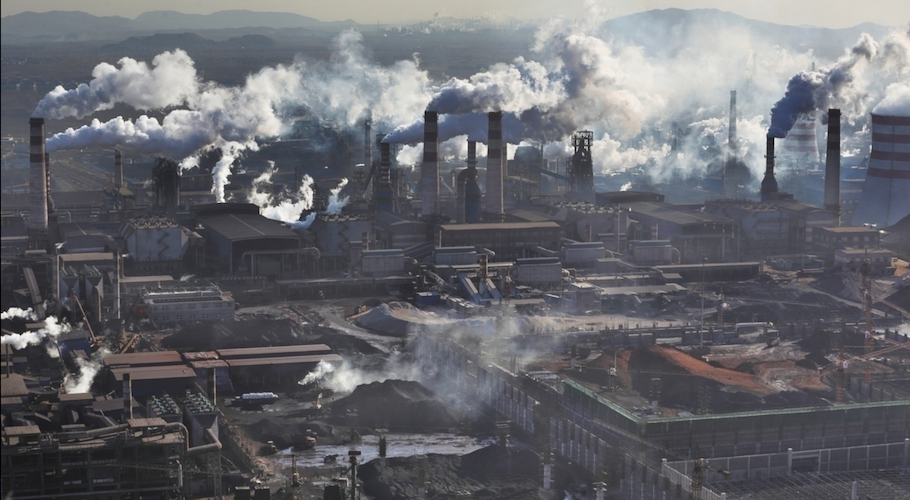
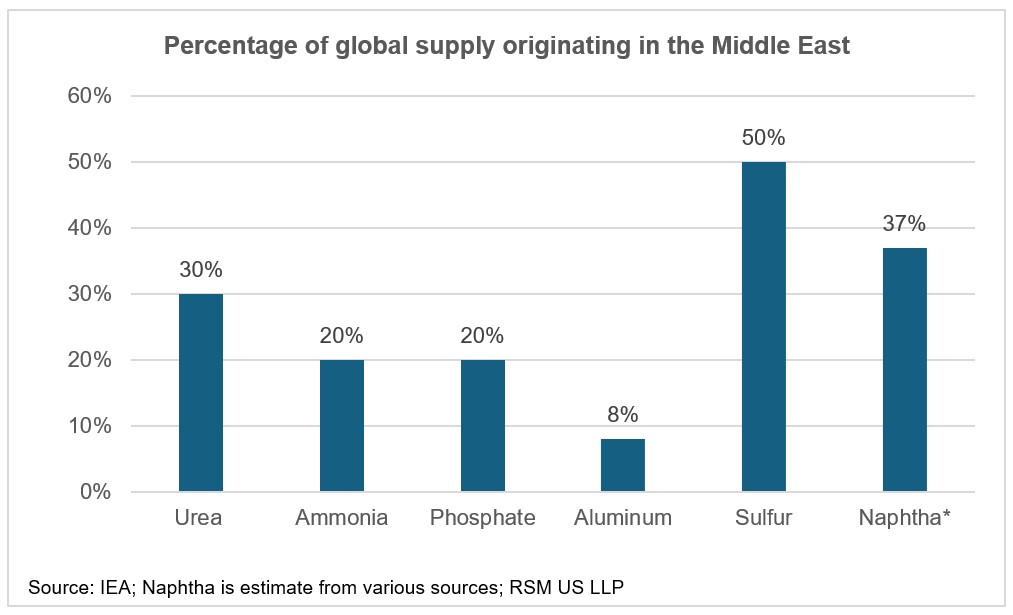
Sectors such as petrochemicals, steel, and rubber have faced margin compression due to elevated oil prices and higher freight costs. The de-escalation in tensions should bring some relief, particularly via lower energy and naphtha prices. However, the recovery is not expected to be immediate, as supply chains, especially in fertilisers and other commodities, are likely to normalise only gradually due to shipment backlogs and logistical bottlenecks. While input cost pressures have eased from their March-April highs, they remain above pre-conflict levels, and corporate margins in energy-intensive sectors continue to face pressure.
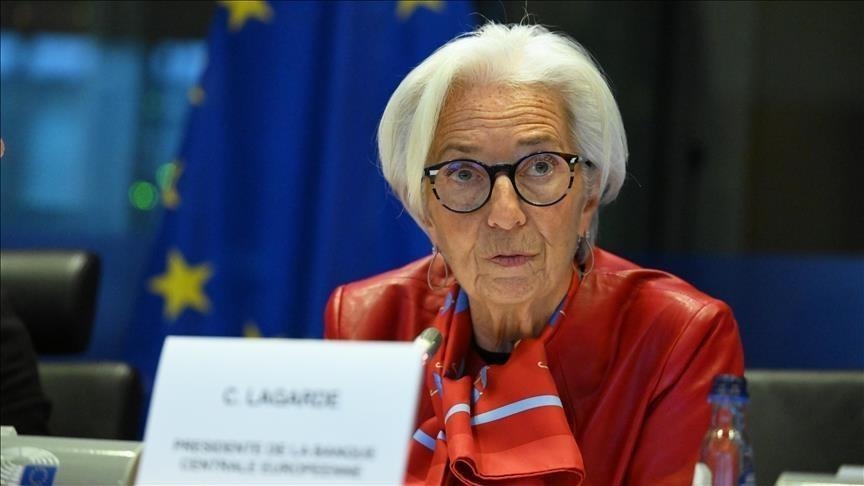
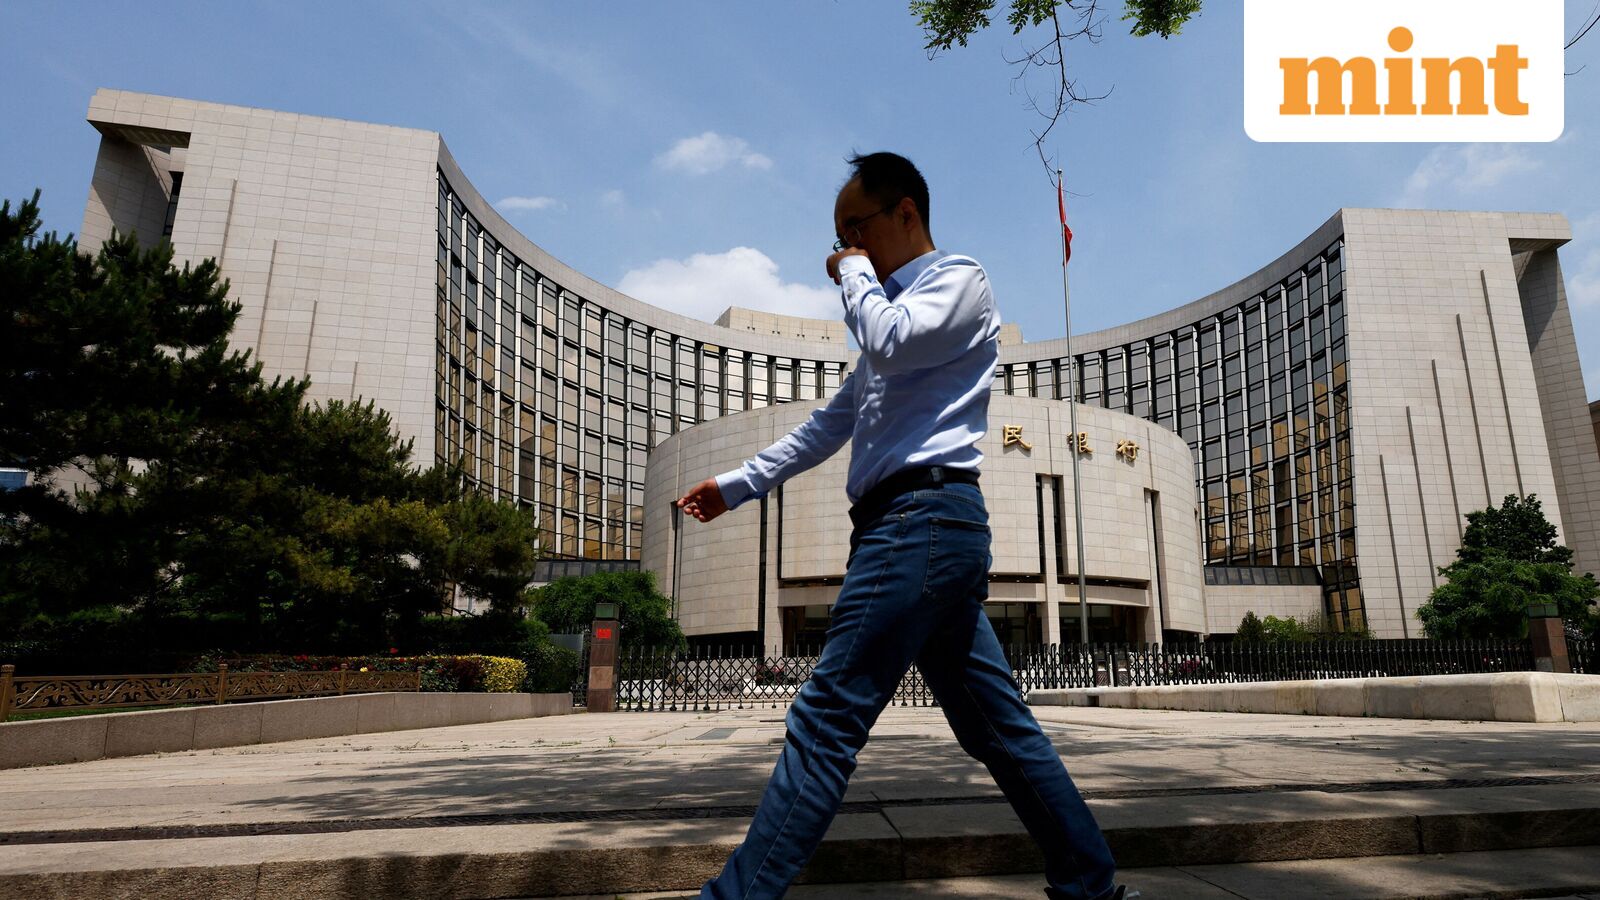
Central Bank Policy Remains Cautious
Despite the peace deal, the report states it is premature to call a turning point in Asia’s rate hike cycle. Central banks operate with different policy reaction functions; for example, the Philippines focuses heavily on CPI inflation, while Bank Indonesia prioritises currency stability. Policymakers are expected to remain cautious, as oil flows are projected to resume only gradually and the need to rebuild depleted stockpiles could keep upward pressure on demand. The report notes that Brent is expected to average around USD 87 per barrel in the third quarter, still roughly 30% above pre-war levels. Food prices also remain vulnerable to weather-related shocks, particularly the rising probability of a strong El Nino, which could keep overall inflation volatile.
Improved Growth Prospects for Korea and Japan
South Korea and Japan, despite heavy reliance on Middle Eastern energy, have limited the impact on growth and inflation through price caps, subsidies, and energy import diversification. A peace deal is expected to boost third-quarter 2026 growth slightly more than expected. Improving energy supply should support growth by easing pressure on key industries and lifting confidence, allowing Korea’s petrochemical output and exports to rebound and Japan’s auto exports to the Middle East to recover. The impact on inflation from the peace deal is likely to be limited, as inflation in both countries has been suppressed by policy measures. The report sees an increasing probability that both central banks may accelerate their hiking cycles, with the Bank of Korea potentially needing an additional hike beyond its current 75 basis point base case, likely in 2027. For the Bank of Japan, its next move could come earlier in October rather than December if yen weakness and firm underlying inflation persist.
Taiwan Rate Hikes Could Be Delayed
In Taiwan, a peace deal removes some potential downside risk for growth. Given Taiwan’s heavy energy import dependence, falling oil prices will have a bigger impact on inflation. The report revises down its CPI inflation forecast from 2.1% to 1.9% year-on-year. If a lasting peace deal leads to lower energy prices and inflation proves under control, a previously pencilled-in rate hike for the third quarter of 2026 could be delayed, potentially to as far as 2027.
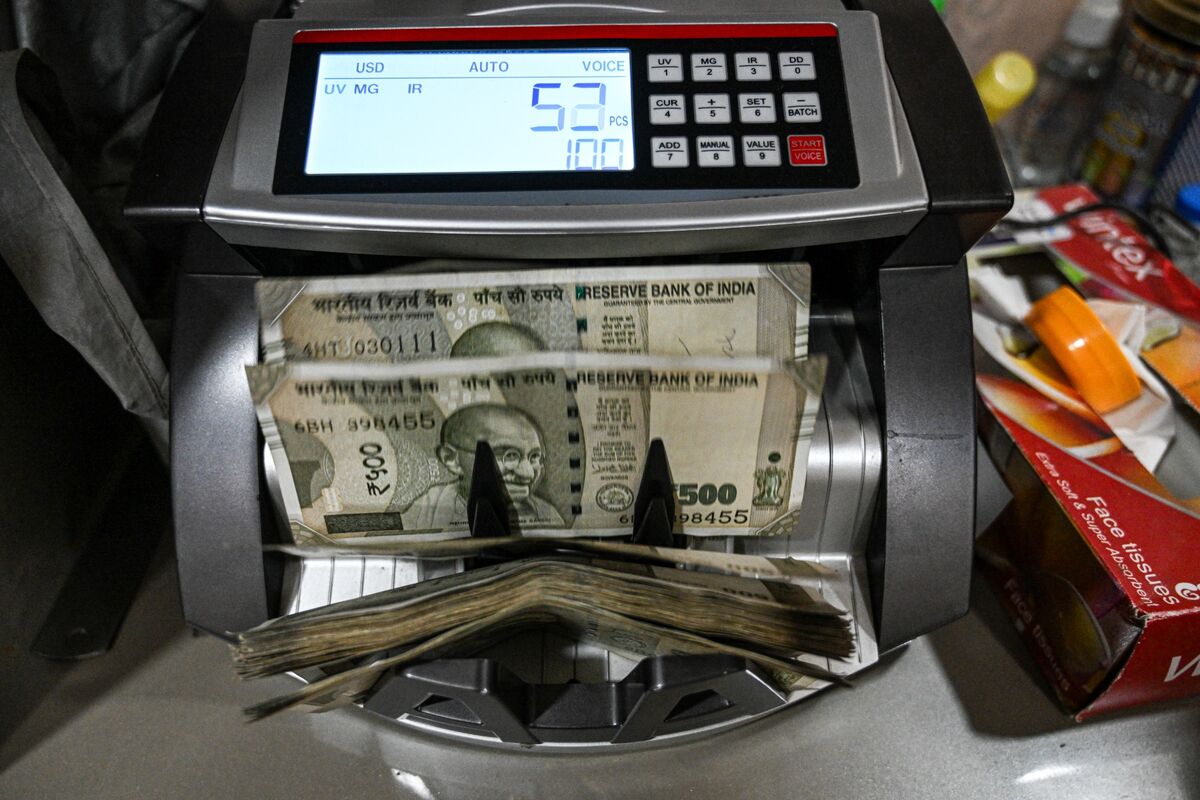
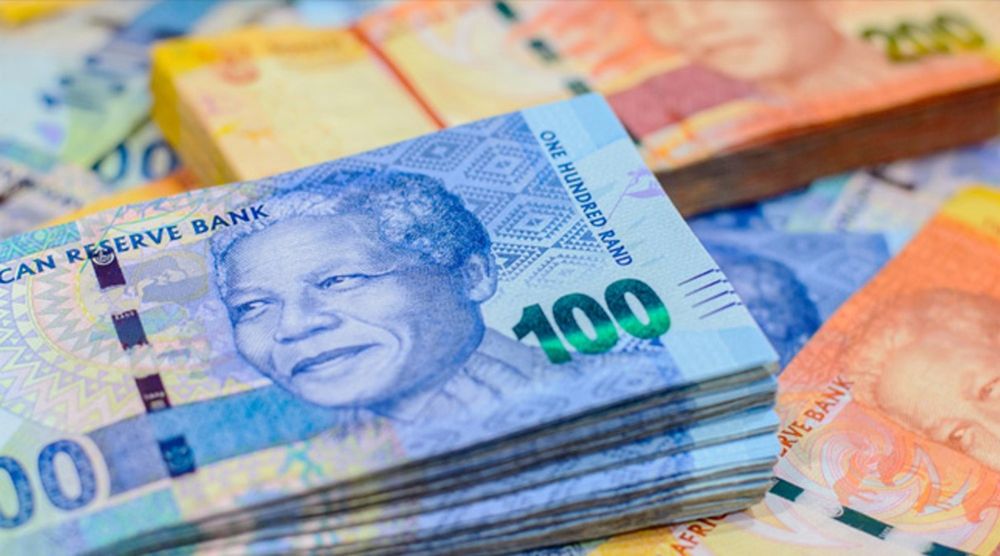
Asian Currencies and Monetary Policy Outlook
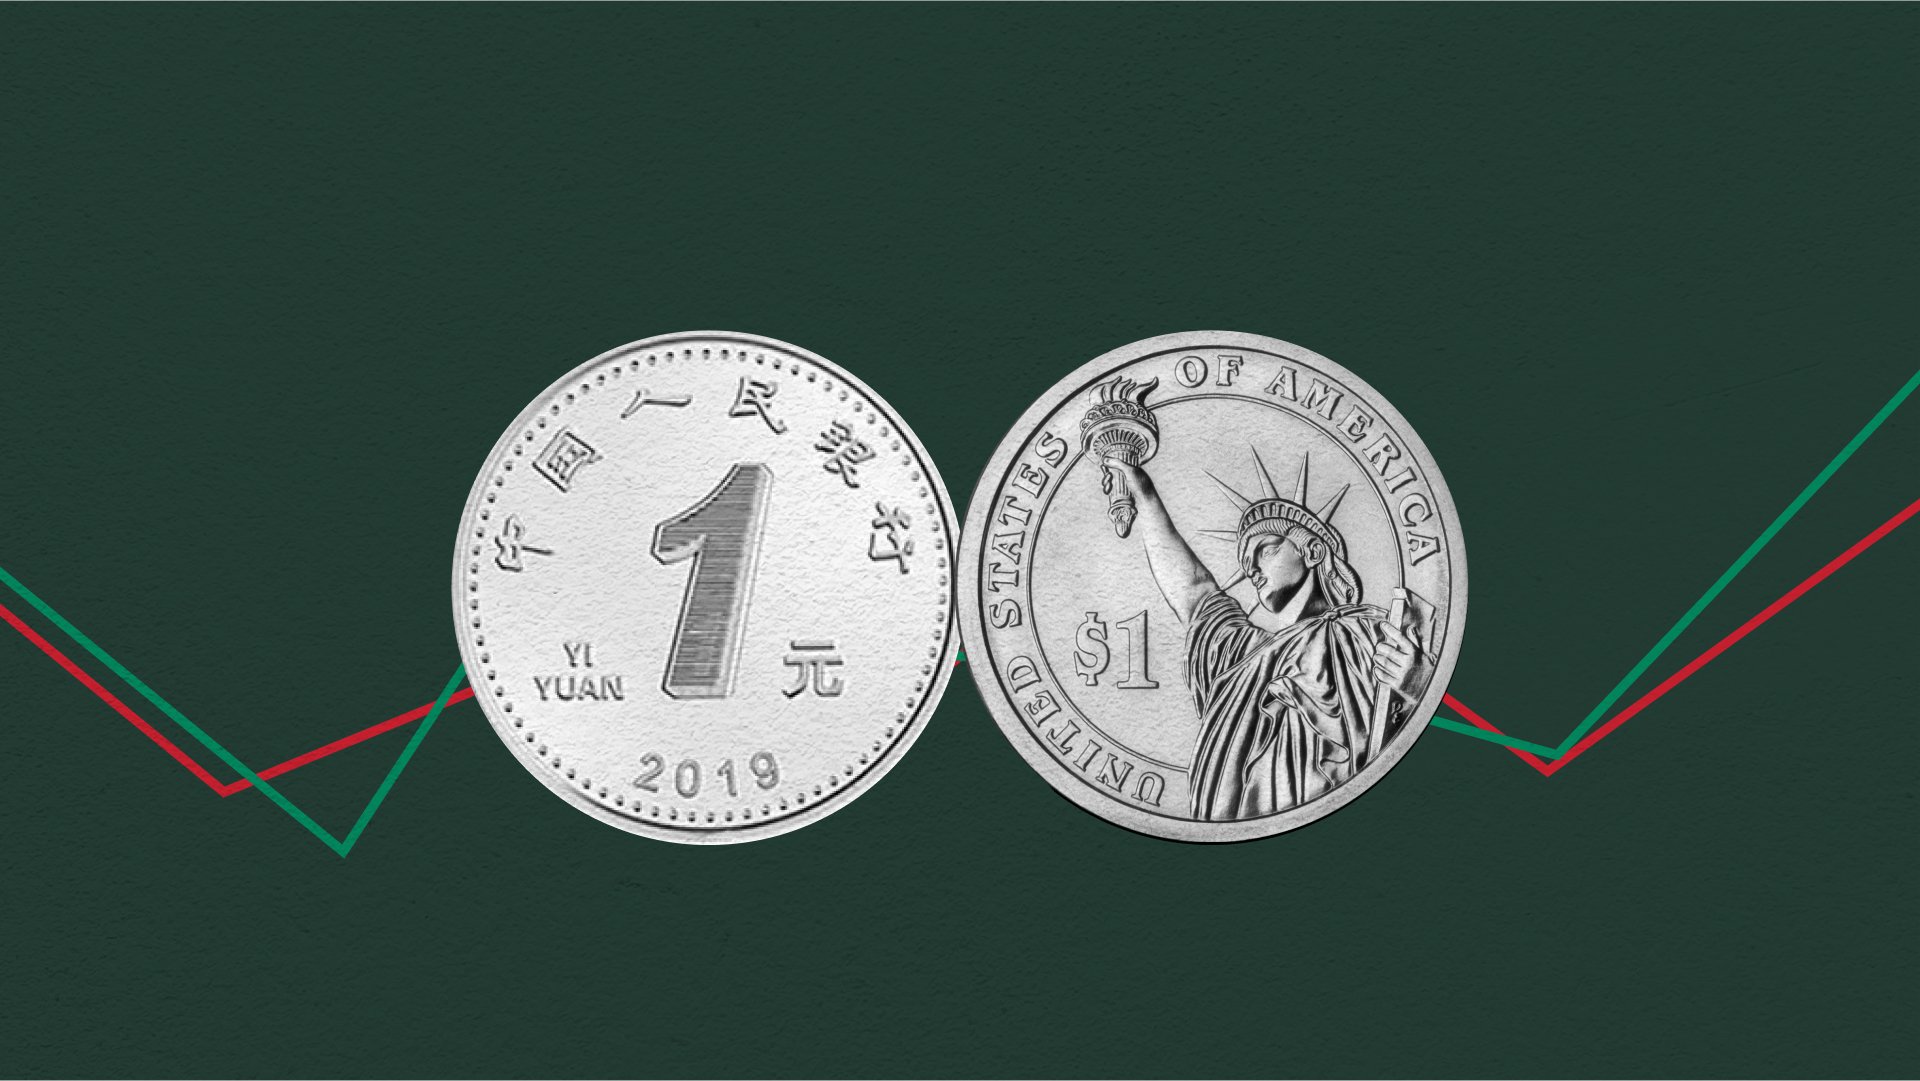
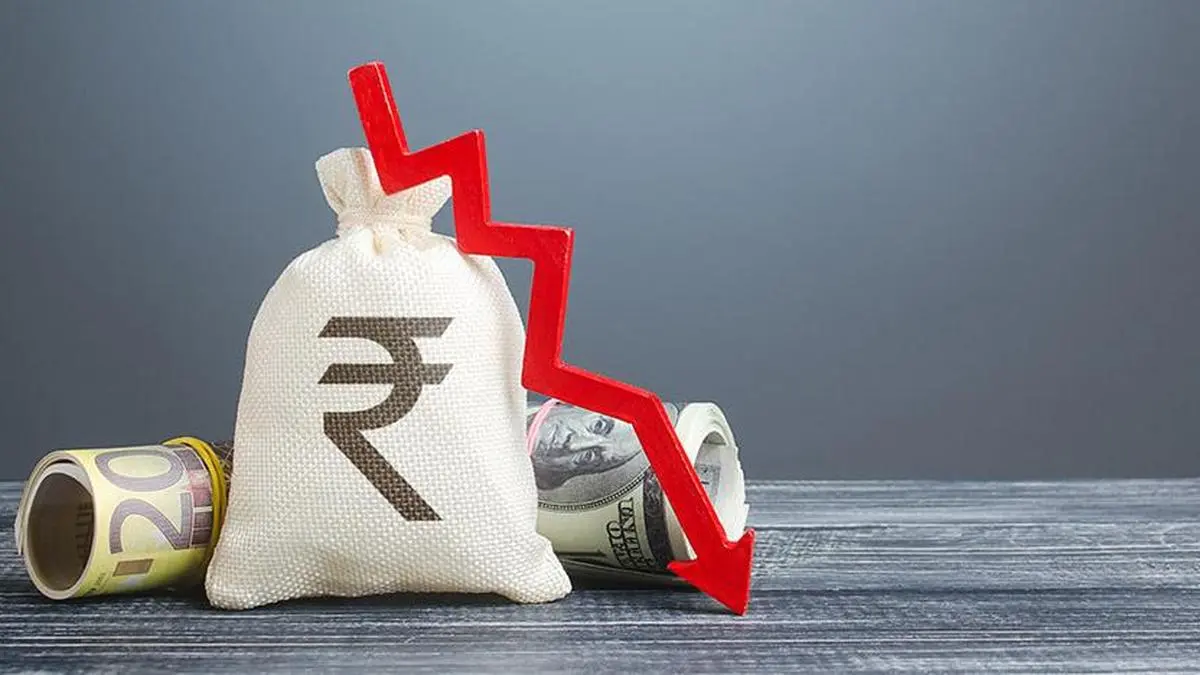
Asian currencies are stabilising but will need more for a sustained turn. Indonesia’s rupiah, the Indian rupee, and the Thai baht have fallen the most against the US dollar this year. For a more durable turnaround, stronger local drivers will be crucial, including a sustained improvement in the terms of trade via lower oil prices. The report sees relatively more support for the Indian rupee, which still has policy levers at its disposal. In North Asia, both the Korean won and Japanese yen have weakened significantly, though easing geopolitical tensions should provide some relief. The Chinese yuan has been the top performer against the US dollar during the Iran war, but its relative outperformance is likely to fade if the peace deal holds. All things considered, monetary policy in Asia is still set to remain tighter for longer than markets anticipate.
-
1. INTRODUCTION
Making Data-Driven Decisions to Grow Your Business
- REPORT DESCRIPTION
- RESEARCH METHODOLOGY AND THE AI PLATFORM
- DATA-DRIVEN DECISIONS FOR YOUR BUSINESS
- GLOSSARY AND SPECIFIC TERMS
-
2. EXECUTIVE SUMMARY
A Quick Overview of Market Performance
- KEY FINDINGS
- MARKET TRENDS This Chapter is Available Only for the Professional EditionPRO
-
3. MARKET OVERVIEW
Understanding the Current State of The Market and its Prospects
- MARKET SIZE: HISTORICAL DATA (2012–2025) AND FORECAST (2026–2035)
- CONSUMPTION BY COUNTRY: HISTORICAL DATA (2012–2025) AND FORECAST (2026–2035)
- MARKET FORECAST TO 2035
-
4. MOST PROMISING PRODUCTS FOR DIVERSIFICATION
Finding New Products to Diversify Your Business
- TOP PRODUCTS TO DIVERSIFY YOUR BUSINESS
- BEST-SELLING PRODUCTS
- MOST CONSUMED PRODUCTS
- MOST TRADED PRODUCTS
- MOST PROFITABLE PRODUCTS FOR EXPORT
-
5. MOST PROMISING SUPPLYING COUNTRIES
Choosing the Best Countries to Establish Your Sustainable Supply Chain
- TOP COUNTRIES TO SOURCE YOUR PRODUCT
- TOP PRODUCING COUNTRIES
- TOP EXPORTING COUNTRIES
- LOW-COST EXPORTING COUNTRIES
-
6. MOST PROMISING OVERSEAS MARKETS
Choosing the Best Countries to Boost Your Export
- TOP OVERSEAS MARKETS FOR EXPORTING YOUR PRODUCT
- TOP CONSUMING MARKETS
- UNSATURATED MARKETS
- TOP IMPORTING MARKETS
- MOST PROFITABLE MARKETS
-
7. PRODUCTION
The Latest Trends and Insights into The Industry
- PRODUCTION VOLUME AND VALUE: HISTORICAL DATA (2012–2025) AND FORECAST (2026–2035)
- PRODUCTION BY COUNTRY: HISTORICAL DATA (2012–2025) AND FORECAST (2026–2035)
-
8. IMPORTS
The Largest Import Supplying Countries
- IMPORTS: HISTORICAL DATA (2012–2025) AND FORECAST (2026–2035)
- IMPORTS BY COUNTRY: HISTORICAL DATA (2012–2025) AND FORECAST (2026–2035)
- IMPORT PRICES BY COUNTRY: HISTORICAL DATA (2012–2025) AND FORECAST (2026–2035)
-
9. EXPORTS
The Largest Destinations for Exports
- EXPORTS: HISTORICAL DATA (2012–2025) AND FORECAST (2026–2035)
- EXPORTS BY COUNTRY: HISTORICAL DATA (2012–2025) AND FORECAST (2026–2035)
- EXPORT PRICES BY COUNTRY: HISTORICAL DATA (2012–2025) AND FORECAST (2026–2035)
-
10. PROFILES OF MAJOR PRODUCERS
The Largest Producers on The Market and Their Profiles
-
11. COUNTRY PROFILES
The Largest Markets And Their Profiles
This Chapter is Available Only for the Professional Edition
PRO-
11.1
United States
- Market Size
- Production
- Imports
- Exports
-
11.2
China
- Market Size
- Production
- Imports
- Exports
-
11.3
Japan
- Market Size
- Production
- Imports
- Exports
-
11.4
Germany
- Market Size
- Production
- Imports
- Exports
-
11.5
United Kingdom
- Market Size
- Production
- Imports
- Exports
-
11.6
France
- Market Size
- Production
- Imports
- Exports
-
11.7
Brazil
- Market Size
- Production
- Imports
- Exports
-
11.8
Italy
- Market Size
- Production
- Imports
- Exports
-
11.9
Russian Federation
- Market Size
- Production
- Imports
- Exports
-
11.10
India
- Market Size
- Production
- Imports
- Exports
-
11.11
Canada
- Market Size
- Production
- Imports
- Exports
-
11.12
Australia
- Market Size
- Production
- Imports
- Exports
-
11.13
Republic of Korea
- Market Size
- Production
- Imports
- Exports
-
11.14
Spain
- Market Size
- Production
- Imports
- Exports
-
11.15
Mexico
- Market Size
- Production
- Imports
- Exports
-
11.16
Indonesia
- Market Size
- Production
- Imports
- Exports
-
11.17
Netherlands
- Market Size
- Production
- Imports
- Exports
-
11.18
Turkey
- Market Size
- Production
- Imports
- Exports
-
11.19
Saudi Arabia
- Market Size
- Production
- Imports
- Exports
-
11.20
Switzerland
- Market Size
- Production
- Imports
- Exports
-
11.21
Sweden
- Market Size
- Production
- Imports
- Exports
-
11.22
Nigeria
- Market Size
- Production
- Imports
- Exports
-
11.23
Poland
- Market Size
- Production
- Imports
- Exports
-
11.24
Belgium
- Market Size
- Production
- Imports
- Exports
-
11.25
Argentina
- Market Size
- Production
- Imports
- Exports
-
11.26
Norway
- Market Size
- Production
- Imports
- Exports
-
11.27
Austria
- Market Size
- Production
- Imports
- Exports
-
11.28
Thailand
- Market Size
- Production
- Imports
- Exports
-
11.29
United Arab Emirates
- Market Size
- Production
- Imports
- Exports
-
11.30
Colombia
- Market Size
- Production
- Imports
- Exports
-
11.31
Denmark
- Market Size
- Production
- Imports
- Exports
-
11.32
South Africa
- Market Size
- Production
- Imports
- Exports
-
11.33
Malaysia
- Market Size
- Production
- Imports
- Exports
-
11.34
Israel
- Market Size
- Production
- Imports
- Exports
-
11.35
Singapore
- Market Size
- Production
- Imports
- Exports
-
11.36
Egypt
- Market Size
- Production
- Imports
- Exports
-
11.37
Philippines
- Market Size
- Production
- Imports
- Exports
-
11.38
Finland
- Market Size
- Production
- Imports
- Exports
-
11.39
Chile
- Market Size
- Production
- Imports
- Exports
-
11.40
Ireland
- Market Size
- Production
- Imports
- Exports
-
11.41
Pakistan
- Market Size
- Production
- Imports
- Exports
-
11.42
Greece
- Market Size
- Production
- Imports
- Exports
-
11.43
Portugal
- Market Size
- Production
- Imports
- Exports
-
11.44
Kazakhstan
- Market Size
- Production
- Imports
- Exports
-
11.45
Algeria
- Market Size
- Production
- Imports
- Exports
-
11.46
Czech Republic
- Market Size
- Production
- Imports
- Exports
-
11.47
Qatar
- Market Size
- Production
- Imports
- Exports
-
11.48
Peru
- Market Size
- Production
- Imports
- Exports
-
11.49
Romania
- Market Size
- Production
- Imports
- Exports
-
11.50
Vietnam
- Market Size
- Production
- Imports
- Exports
-
-
LIST OF TABLES
- Key Findings In 2025
- Market Volume, In Physical Terms: Historical Data (2012–2025) and Forecast (2026–2035)
- Market Value: Historical Data (2012–2025) and Forecast (2026–2035)
- Per Capita Consumption, by Country, 2022–2025
- Production, In Physical Terms, By Country: Historical Data (2012–2025) and Forecast (2026–2035)
- Imports, In Physical Terms, By Country: Historical Data (2012–2025) and Forecast (2026–2035)
- Imports, In Value Terms, By Country: Historical Data (2012–2025) and Forecast (2026–2035)
- Import Prices, By Country: Historical Data (2012–2025) and Forecast (2026–2035)
- Exports, In Physical Terms, By Country: Historical Data (2012–2025) and Forecast (2026–2035)
- Exports, In Value Terms, By Country: Historical Data (2012–2025) and Forecast (2026–2035)
- Export Prices, By Country: Historical Data (2012–2025) and Forecast (2026–2035)
-
LIST OF FIGURES
- Market Volume, In Physical Terms: Historical Data (2012–2025) and Forecast (2026–2035)
- Market Value: Historical Data (2012–2025) and Forecast (2026–2035)
- Consumption, by Country, 2025
- Market Volume Forecast to 2035
- Market Value Forecast to 2035
- Market Size and Growth, By Product
- Average Per Capita Consumption, By Product
- Exports and Growth, By Product
- Export Prices and Growth, By Product
- Production Volume and Growth
- Exports and Growth
- Export Prices and Growth
- Market Size and Growth
- Per Capita Consumption
- Imports and Growth
- Import Prices
- Production, In Physical Terms: Historical Data (2012–2025) and Forecast (2026–2035)
- Production, In Value Terms: Historical Data (2012–2025) and Forecast (2026–2035)
- Production, by Country, 2025
- Production, In Physical Terms, by Country: Historical Data (2012–2025) and Forecast (2026–2035)
- Imports, In Physical Terms: Historical Data (2012–2025) and Forecast (2026–2035)
- Imports, In Value Terms: Historical Data (2012–2025) and Forecast (2026–2035)
- Imports, In Physical Terms, By Country, 2025
- Imports, In Physical Terms, By Country: Historical Data (2012–2025) and Forecast (2026–2035)
- Imports, In Value Terms, By Country: Historical Data (2012–2025) and Forecast (2026–2035)
- Import Prices, By Country: Historical Data (2012–2025) and Forecast (2026–2035)
- Exports, In Physical Terms: Historical Data (2012–2025) and Forecast (2026–2035)
- Exports, In Value Terms: Historical Data (2012–2025) and Forecast (2026–2035)
- Exports, In Physical Terms, By Country, 2025
- Exports, In Physical Terms, By Country: Historical Data (2012–2025) and Forecast (2026–2035)
- Exports, In Value Terms, By Country: Historical Data (2012–2025) and Forecast (2026–2035)
- Export Prices, By Country: Historical Data (2012–2025) and Forecast (2026–2035)