All data for this study were collected through a quality assurance process facilitated by the University of Sydney research team and as approved by the Human Research Ethics Committee. According to the National Health and Medical Research Council’s National Statement on Ethical Conduct in Human Research (2023), this research was deemed lower risk and eligible for exemption from ethics review. Consent by participants was provided at registration to use the platform. All data is non-identifiable to protect the privacy of participants.
Study design
This cross-sectional study used post-hoc simulations to validate a digital adaptive assessment.
Participants
The sample screened for eligibility from 2304 young people aged 12–25 years who attended one of 12 Australian mental health services between November 2018—September 2024 (i.e., 11 headspace services, and one private practice in the metropolitan area of Sydney). Individuals then completed a comprehensive self-report assessment using the Innowell Platform46, a digital health technology accessed through the internet via a smartphone, tablet, or computer.
Item bank/measures
This study utilized the Innowell Platform to collect individuals’ data across seven standardized and validated self-report measures related to mental health treatment planning9,46. These measures were selected for this study as they have strong psychometric properties for the youth population and correspond to clinical, psychosocial, and medical care pathways in the multidisciplinary youth mental health services from which these data were collected. Therefore, these scales provide a form of multidimensional assessment aligned with real-world treatment planning.
The selected measures assessed psychological distress28 (K-10), psychotic-like experiences29 (PQ16), mania-like experiences30 (ASRM), symptoms of anxiety31 (OASIS), suicidality32 (SIDAS), alcohol use33 (AUDIT-C), and social and occupational functioning34 (WSAS). Each of the seven measures are designed to assess one distinct construct, yielding an item bank of 49 items. Notably, data from the Quick Inventory of Depressive Symptomatology (QIDS) were available, but these items violated monotonicity assumptions and were thus excluded from further analysis (Supplementary Table 9).
There were 33 items scored using a Likert scale structure (e.g., “On a scale of 0-10, how much do you agree with the following statement”). The remaining 16 items (from the PQ-16) were binary Yes/No questions. The SIDAS and AUDIT-C questionnaires were administered with skip logic. For the SIDAS, a response of 0 on the first item (assessing the presence of suicidal thoughts) triggered logical imputation of 0 for the remaining four items, which are used to assess the nature of suicidal thoughts. Similarly, a response of 0 on the first item of the AUDIT-C (assessing alcohol consumption) resulted in automatic scores of 0 for items 2 and 3, to reflect the individual’s non-drinking behavior. A more detailed description of each measure is provided in Supplementary Note 1.
Inclusion criteria
Participants were included in this study if they completed the 49 items from the seven measures at one time point during their care.
Item response theory (IRT)
IRT aims to model the relationship between item responses and one underlying construct (i.e., a latent trait for person j, denoted as θj). This framework uses mathematical non-linear, monotonic functions to estimate the probability of an individual’s specific item response, given θj47,48. Instead of summing up item scores to generate individual totals (as in Classical Test Theory), IRT models patterns of responses across multiple items.
For Likert scales which are common in mental health assessment, IRT models (such as the Graded Response Model; GRM) can estimate the probability of responding to item i in or above category k, given an individual’s latent trait level (θj), with θj assumed to follow a normal distribution with mean = 0 and standard deviation (SD) = 1.
Textbox 1: Graded response model (GRM)
$$P({Y}_{ij}\ge k|{{\rm{\theta }}}_{j})=\frac{1}{1+\exp \left[-{{\rm{a}}}_{{\rm{i}}}\left({{\rm{\theta }}}_{{\rm{j}}}-{{\rm{b}}}_{ik}\right)\right]}$$
(1)
Yij: Response to item i for person j
\({a}_{i}\): Discrimination parameter for item i
\({b}_{{ik}}\): Difficulty parameter for category k of item i where bik increases with k .
\({\theta }_{j}\): Latent trait level (e.g., anxiety) for person j
In the GRM, we can derive the likelihood of responding to an item’s score using cumulative probabilities.
Textbox 2. Probability of observed response category
$$P({Y}_{ij}=k|{{{\theta }}}_{{{j}}})={\rm{P}}({{\rm{Y}}}_{ij}\ge {\rm{k}}|{{{\theta }}}_{{{j}}})-{\rm{P}}({{\rm{Y}}}_{ij}\ge {\rm{k}}+1|{{{\theta }}}_{{{j}}})$$
(2)
Extending this problem beyond the unidimensional space would be to consider that θj is not one but several traits that may or may not be correlated. In unidimensional IRT models, the covariation between item responses is explained by a single underlying latent trait, whereas multidimensional IRT (MIRT) models explain the covariation between item responses through multiple latent traits49. This is useful in mental health assessments because of the inter-relationships among symptoms and other relevant treatment factors (e.g., functioning, alcohol use).
This study aims to solve for θj – a latent trait vector representing multiple dimensions (i.e., multiple mental health assessment scores representing different symptoms and other clinically relevant factors).
Textbox 3. Multidimensional graded response model
$$\begin{array}{l}\begin{array}{l}P\left({Y}_{ij}\ge k|{{\boldsymbol{\theta }}}_{j}\right)\end{array}\end{array}=\frac{1}{1+\exp \left[-\left({{\boldsymbol{\alpha }}}_{{\rm{i}}}^{{\bf{T}}}{{\boldsymbol{\theta }}}_{{{j}}}+{{{d }}}_{\mathrm{ik}}\right)\right]}$$
(3)
Yij: Response to item i for person j
\({{\boldsymbol{\alpha }}}_{i}\): Discrimination parameters for item i
\({d }_{{ik}}\): Intercept parameter for category k of item i where dik decreases as k increases.
\({{\boldsymbol{\theta }}}_{j}\): Latent trait level (e.g., anxiety) for person j across m dimensions, where \({{\boldsymbol{\theta }}}_{j}=({{\rm{\theta }}}_{j1},{{\rm{\theta }}}_{j2},\ldots ,{{\rm{\theta }}}_{{jm}})\)
Multidimensional computerized adaptive testing (MCAT)
The CAT methodology utilizes IRT to create personalized and dynamic assessments. This process involves calibrating an item bank to identify how well each item aligns with each latent trait. Once the item bank is calibrated and parameters are estimated, the CAT can be developed. During a CAT, when an individual answers a question, the algorithm updates latent trait estimates (θj) before presenting a new question that will maximize the information gain. In MCAT, the Fisher Information matrix can be used to quantify the information gained from each item by capturing corresponding information onto the direct trait as well as the covariance between traits50. The test continues until a predefined level of precision is achieved across all latent trait estimates (e.g., minimizing standard error) or it reaches the predefined maximum item limit.
Model specification
Each item was assigned to one domain based on its corresponding legacy scale, but domain scores were estimated concurrently by allowing for inter-domain correlations. Thus, the model explained seven latent traits, each representing a dimension of θj that corresponded to one of the assessed scales. Covariation among latent traits was permitted so that information from individual items could spread multidimensionally via the covariance matrix. Because we modeled several domains with a mix of item types, the MHRM algorithm was used to estimate item parameters. A comparison of this correlated multidimensional structure was compared with the bifactor model (Supplementary Fig. 5). The bifactor model failed to converge after 5000 cycles using the Expectation-Maximization algorithm. Thus, the bifactor model was discarded from further analyses, and the correlated multidimensional model was used for MCAT simulations.
Assumptions of multidimensional item response theory (MIRT)
Two key assumptions of MIRT were tested on the 49 items: monotonicity (as θ increases, the probability of endorsing higher item responses increases) and local dependence (item responses should be independent after accounting for latent traits). Monotonicity checks were conducted by inspecting whether each item’s Loevinger’s H coefficient was above 0.3. Local dependence was assessed using Yen’s Q3, which calculates the correlation between item residuals after accounting for the latent traits51. We inspected Q3 values both locally (by fitting separate unidimensional models for each domain) and globally (using the complete model).
Simulated assessments using multidimensional computerized adaptive testing
Using the preferred model structure, we then conducted post-hoc MCAT simulations to estimate the performance and efficiency of the dynamic assessment. The simulations demonstrate how the model would perform if it was administered to real assessment-taking participants. To reduce the risk of overfitting, we conducted ten-fold cross-validation. In each fold, the model was trained on 90% of the data and the assessment was tested on the remaining 10% of (unseen) data. This process was repeated 10 times, so that each simulated participant was included in the test set exactly once.
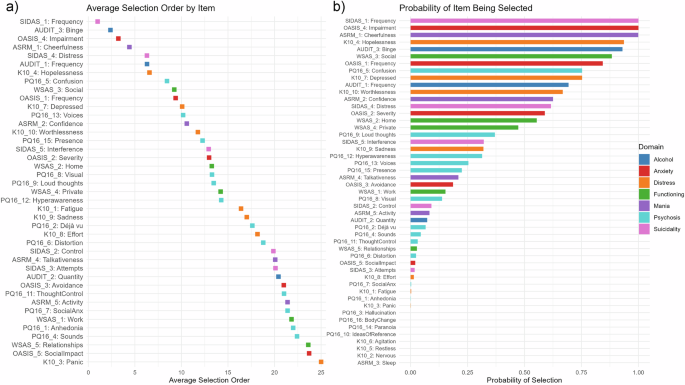
An individual’s latent trait estimates were updated using expected a posteriori (EAP) estimation. Items were selected using the Determinant Posterior Rule, which selects the next item as the one that maximizes the determinant of the posterior Fisher information matrix50. That is the item that, given an individual’s current estimates for θj, would achieve the most reduction in uncertainty across all latent traits. At the start of each assessment a multivariate standard normal distribution was assumed for θj, resulting in trait estimates of 0 before any items were administered.
To evaluate efficiency and accuracy of the MCAT, we first conducted a simulated assessment on the entire item bank (number of items = 49). The mean SEM for θj (for all estimated traits) was observed at each item to understand model performance and tailor stopping criteria for adaptive simulated assessments.
Using the full item bank simulation, hyper-parameter optimization was conducted with three stopping rules (justified by popular use in CAT simulation studies)22,25,52:
-
1.
A minimum item threshold (i.e., requiring a set number of items before stopping was permitted)
-
2.
A maximum item limit (i.e., concluding the assessment at a specific number of items)
-
3.
Absolute change in θj rule (i.e., the assessment ends when the absolute change in θj estimates between successive item responses falls below a predefined threshold)—known herein as ∆θj
The minimum item threshold prevents the assessment from prematurely concluding before sufficient coverage across each domain, while the maximum item limit constrains response burden by stopping the assessment when additional items are unlikely to meaningfully improve estimate precision (e.g., for extreme cases). The ∆θj rule acts as a convergence criterion that monitors the stability of estimates and identifies when further information is unlikely to significantly change estimated values.
Given that the objective of this study was to shorten the questionnaire battery while maintaining absolute agreement with the true full-length scores, hyperparameters were optimized using a grid search. This process searches for stopping criteria that produce the minimum required items per assessment (on average across the sample) such that all domain-level estimates achieved ICCs ≥ 0.75 with full-length scores, which indicates “good” or “excellent” agreement53. The hyperparameter space was informed by the full item bank simulation and previous CAT simulation studies22,25,52. Comparing multiple stopping criteria would demonstrate the robustness of results under different hyperparameter configurations, while also highlighting the relationship between increasing the average items used and the absolute agreement between true and estimated assessment scores.
Evaluation metrics
Efficiency and accuracy metrics for each MCAT simulation were recorded as an average across the 10 folds. Efficiency was measured by the mean and median number of items administered across the whole assessment. By calculating the time taken to complete each assessment scale, this value was then converted into an estimated time taken to complete the MCAT. Absolute agreement was measured by two-way mixed-effects ICCs (i.e., the degree to which the individual’s estimated score aligned with their full-length score), Pearson correlation coefficient (r; measuring the linear relationship between the individual’s estimated score and their full-length score), and mean absolute error (i.e., an average absolute difference between estimated and true scores, represented as both real values and percentage error relative to the domain’s maximum score).
Doman- and item-level findings will be based on the simulation results determined by the optimal stopping criteria configuration (minimum ICC ≥ 0.75).
Statistical software
The mirt and mirtCAT packages in R (version 4.2.1) were used for fitting the multidimensional IRT models and conducting the MCAT simulations54,55.