


Imagine the cryptocurrency market as a giant pie. Bitcoin dominance (BTC.D) shows what share of that pie belongs to Bitcoin. The higher the dominance, the larger Bitcoin’s market share. Conversely, dominance declines as capital flows into altcoins.
For traders, BTC dominance acts as a compass, helping identify where capital is moving and avoid buying altcoins when investors are fleeing to Bitcoin during periods of market uncertainty. It also supports more informed trading decisions and helps avoid common mistakes at different stages of the market cycle. For beginners, understanding BTC dominance is essential. Without it, navigating the cryptocurrency market is like trading blind.
It is important to remember that Bitcoin dominance is neither a price nor a trading volume indicator. Instead, it is a ratio that reflects investor sentiment. During risk-off periods, investors tend to move capital into Bitcoin, viewing it as the most reliable cryptocurrency. When market sentiment shifts toward risk-taking, capital often rotates into altcoins in search of higher returns. In this sense, BTC.D acts as a thermometer, measuring the balance between fear and greed in the crypto market.
Let’s examine how Bitcoin dominance is calculated, how to interpret the BTC.D chart, and, most importantly, how to apply this knowledge in real trading.
The article covers the following subjects:
Major Takeaways
-
Bitcoin dominance is the ratio of Bitcoin market cap to the total crypto market cap. The higher the percentage, the larger Bitcoin’s share of the overall crypto market.
-
Bitcoin dominance is calculated by dividing Bitcoin’s market cap by the total cryptocurrency market capitalization and multiplying the result by 100%.
-
Rising Bitcoin dominance may signal either a flight to safety during a bear market or the early stages of a bull market, when capital typically flows into Bitcoin before rotating into altcoins.
-
Declining Bitcoin dominance often signals the beginning of an altseason, when altcoins outperform Bitcoin.
-
The Bitcoin dominance chart (BTC.D) is a standalone technical analysis tool available on all major platforms.
-
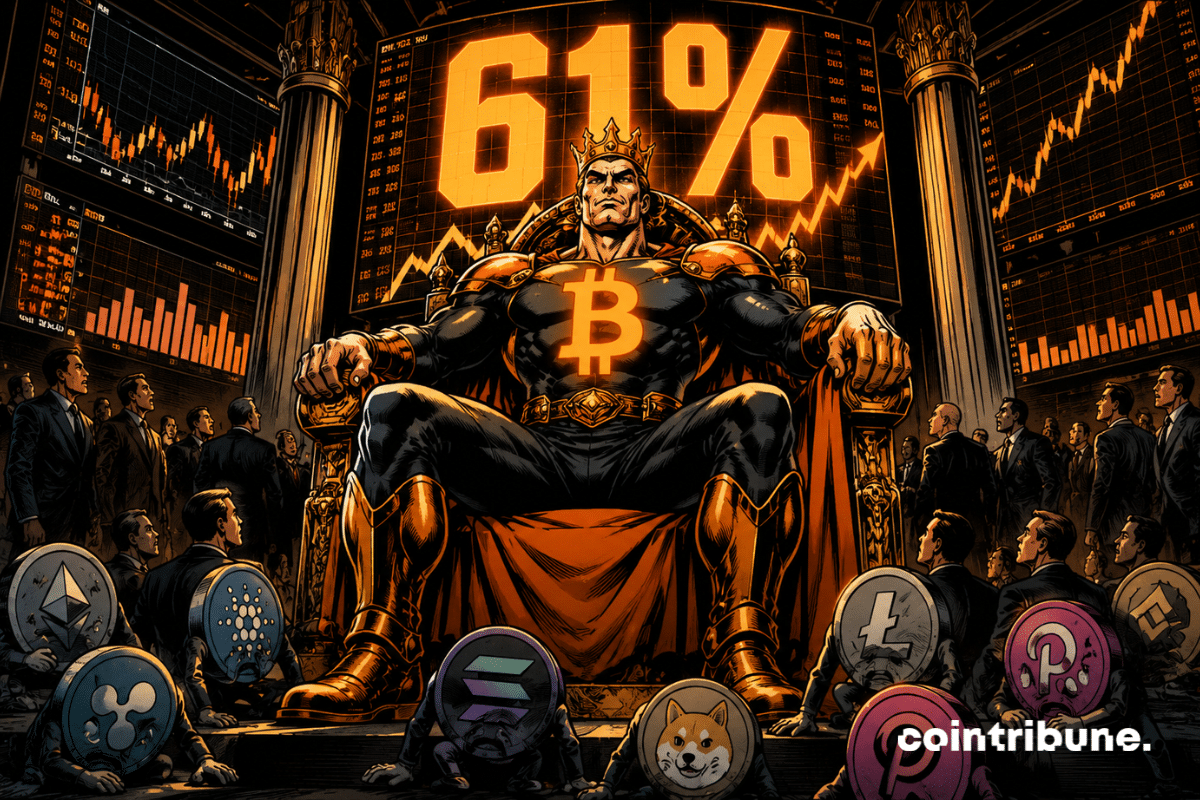
Bitcoin dominance ended 2024 at approximately 56.7% and rose above 60% in 2025, driven by continued institutional inflows into spot Bitcoin ETFs approved in early 2024.
-
Bitcoin’s historical low in dominance was recorded in January 2018, when the indicator fell to around 35% at the peak of the ICO boom.
-
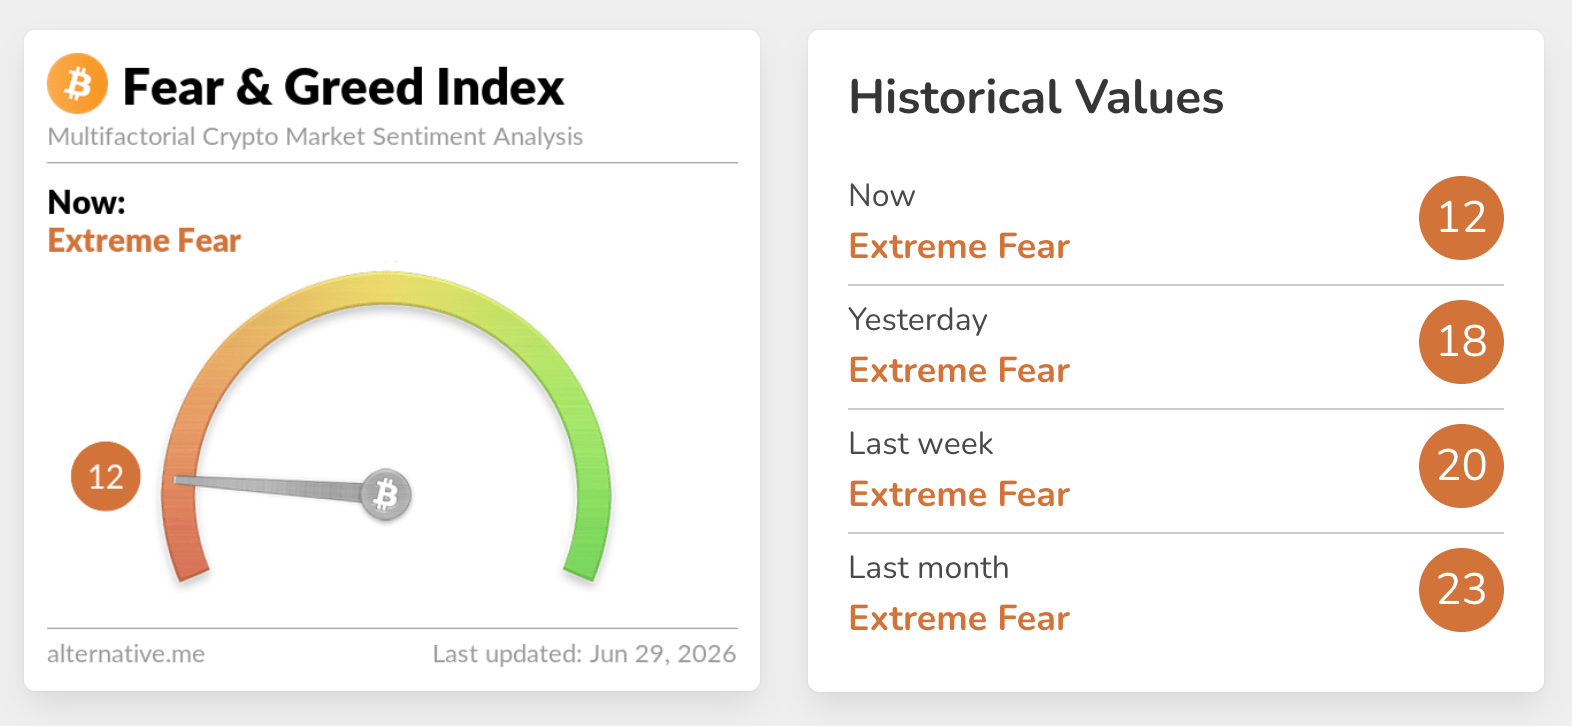
BTC dominance is a key indicator of investor sentiment and changing market trends. It is often used alongside the Fear & Greed Index and on-chain metrics.
What Is Bitcoin Dominance?
Bitcoin dominance (Bitcoin Dominance, or BTC.D) is a metric measuring Bitcoin’s share of the total cryptocurrency market capitalization.
Simply put, if the total cryptocurrency market capitalization is $2 trillion and Bitcoin's market capitalization is $1.2 trillion, Bitcoin dominance is 60%. This means that Bitcoin accounts for 60% of the total cryptocurrency market capitalization, while the remaining 40% is distributed among thousands of other projects, ranging from Ethereum and Solana to niche altcoins and outright scams that are widespread across the crypto market.
The significance of Bitcoin dominance extends far beyond a simple percentage. It serves as a barometer of investor confidence in the cryptocurrency market as a whole. When market conditions become unstable and the macroeconomic environment deteriorates, crypto traders tend to rotate into Bitcoin, viewing it as the most established asset. As confidence returns and greed begins to outweigh fear, investors once again seek higher returns in altcoins. For this reason, Bitcoin dominance is often referred to as the crypto market’s risk appetite indicator.
How Bitcoin Dominance Is Calculated
The formula for calculating Bitcoin dominance is straightforward and easy to understand, even for beginner crypto traders:
BTC.D = (Bitcoin Market Capitalization ÷ Total Cryptocurrency Market Capitalization) × 100%
Bitcoin’s market capitalization is calculated by multiplying the current price of one BTC by the number of coins currently in circulation. Why is the circulating supply used instead of the total number of coins ever issued? Because coins that have not yet been mined, have been permanently lost, or are locked in inaccessible wallets do not participate in active trading and therefore are not included in market capitalization as it is traditionally defined.
The total cryptocurrency market capitalization is the combined market capitalization of all crypto assets, from Bitcoin and Ethereum to low-liquidity altcoins. On most charting platforms, this indicator is displayed under the ticker TOTAL.
TOTAL Market Capitalization Chart
It is important to understand that most analytical platforms exclude so-called “dead” projects from their calculations—those with no trading volume, suspended trading, or delisted tokens. Otherwise, the total market capitalization would be artificially inflated, while Bitcoin dominance would appear lower than it actually is.
Let's look at a practical example. Assume Bitcoin is trading at $60,000 and there are 19.5 million BTC currently in circulation. In that case, Bitcoin's market capitalization equals $60,000 × 19,500,000 = $1.17 trillion. If the total cryptocurrency market capitalization at the same time is $2.3 trillion, Bitcoin dominance equals ($1.17 ÷ $2.3) × 100% = 50.9%. This means Bitcoin accounts for slightly more than half of the total cryptocurrency market capitalization.
BTC Price Trajectory and Bitcoin Dominance Chart
There is an important nuance that many beginners overlook: Bitcoin dominance does not directly depend on Bitcoin’s price. Instead, it reflects Bitcoin’s relative performance compared with the rest of the cryptocurrency market. If Bitcoin and altcoins decline by the same percentage, Bitcoin dominance remains unchanged. If Bitcoin falls less than altcoins, Bitcoin dominance increases even as BTC itself loses value. Conversely, if altcoins rise faster than Bitcoin, Bitcoin dominance falls—even during a bull market.
What Affects Bitcoin Dominance?
Bitcoin’s share of the cryptocurrency market is influenced by a combination of factors, and understanding each of them can give traders a significant advantage. The three main drivers are:
-
Price performance. The relative price performance of Bitcoin compared with altcoins is the most obvious driver. If Bitcoin outperforms most altcoins, its crypto market share increases. Conversely, if altcoins rise faster than Bitcoin, BTC’s dominance declines.
-
The emergence of new large-cap cryptocurrencies. When a major new cryptocurrency enters the market—such as the token of a new DeFi protocol or infrastructure blockchain—the total cryptocurrency market capitalization increases. If Bitcoin’s market capitalization remains unchanged, its market share is automatically diluted.
-
Changes in circulating supply. Token burns and locking up a significant portion of a project’s token supply—for example, tokens allocated to the development team or foundation that have not yet entered circulation—can reduce an asset’s circulating supply and affect its market capitalization. For Bitcoin, the most important event affecting supply is the halving, which reduces the issuance of new coins and increases scarcity.
In addition, macroeconomic factors such as Federal Reserve interest rate decisions, inflation expectations, the US Dollar Index (DXY), and geopolitical developments significantly impact the cryptocurrency market. During periods of heightened global uncertainty, Bitcoin dominance tends to increase, as institutional investors increasingly view Bitcoin as digital gold and a hedge against risk. As a result, when markets shift into risk-off mode, crypto investors typically rotate out of riskier altcoins and into Bitcoin.
How to Read the Bitcoin Dominance Chart (BTC.D)
The Bitcoin dominance chart shows how Bitcoin’s share of the total cryptocurrency market has changed over time. On most trading and analytical platforms, this indicator is displayed as BTC.D or Bitcoin Dominance. Let’s examine the three main scenarios.
Rising BTC.D Trend
When Bitcoin dominance rises steadily, it indicates that Bitcoin is capturing an increasingly larger share of the cryptocurrency market. Capital actively rotates from altcoins into Bitcoin, and for good reason.
The market is in a flight-to-safety phase. Investors, concerned about uncertainty, geopolitical risks, and other macroeconomic factors, shift capital into Bitcoin because of Bitcoin’s established position even if its price is not rising. This pattern is typically observed during bear markets or in the early stages of a bull market, when institutional capital begins entering the crypto sector through its most liquid and widely recognized asset.
Falling BTC.D Trend
When Bitcoin dominance declines, it means that altcoins are outperforming Bitcoin. Capital rotates out of the leading cryptocurrency and into altcoins as traders seek higher returns.
For traders, this is often a sign that an altseason is beginning—a period when many altcoins significantly outperform Bitcoin. For example, during the first half of 2021, BTC.D fell from approximately 70% to 40–45%, while many altcoins appreciated by 10 to 20 times or more. Traders who recognized this decline early and rotated into altcoins were able to substantially increase their capital.
Bitcoin Dominance During the 2021 Altseason
TOTAL3 Altcoin Market Capitalization During the Same Period
Sideways BTC.D Trend
When Bitcoin dominance becomes trapped in a sideways range, the market enters a period of uncertainty. Neither Bitcoin nor altcoins have a clear advantage, and capital waits for a new catalyst. This type of market behavior is typical during accumulation phases, when large investors are building positions, or during corrective phases, when the market is digesting previous price movements.
Interpreting the Bitcoin Dominance Chart from an Altcoin Perspective
When interpreting the BTC.D chart, it is important to remember that it is not a crystal ball that predicts the future. Rather, it is an indicator of current market conditions. It shows what is happening now—not what will happen tomorrow. For a more complete and reliable view of the market, always combine Bitcoin dominance with trading volume analysis, on-chain metrics, and macroeconomic analysis.
What Rising vs Falling Bitcoin Dominance Means
An increase or decrease in Bitcoin dominance reflects changes in how capital is allocated between Bitcoin and the rest of the cryptocurrency market. This indicator helps determine where investor interest is currently concentrated—whether in the relatively conservative Bitcoin or in altcoins that offer the potential for higher returns. However, for an accurate interpretation, Bitcoin dominance should always be analyzed alongside price action and broader market conditions.
Rising Bitcoin Dominance
When Bitcoin dominance rises steadily, it is driven by specific market forces, and understanding them is essential for traders.
The first and most obvious is a flight to quality, or a move toward a safe haven. During periods of market turbulence, investors rotate capital out of altcoins and into Bitcoin, viewing it as the most liquid and well-established digital asset. This is a classic risk management strategy that applies across all financial markets, from equities to cryptocurrencies.
The second factor is a bear market. During prolonged market downturns, Bitcoin dominance typically increases because Bitcoin tends to decline less sharply than most altcoins. This is largely due to Bitcoin’s greater liquidity and its strong standing among institutional investors.
Falling Bitcoin Dominance
Now let’s look at the opposite scenario—periods when Bitcoin dominance declines. What does this indicate?
The first thing that comes to mind is, of course, an altseason. Altcoins are beginning to outperform Bitcoin significantly, and capital is rotating out of the more conservative Bitcoin into riskier assets with greater upside potential. This is a common pattern during the early stages of a cryptocurrency bull market, when investors increasingly shift their attention to altcoins.
The second factor is the emergence of new sectors and market narratives. The DeFi boom in 2020, the NFT surge in 2021, the AI token boom in 2023, and the rise of memecoins in 2024 each created new centers of investor interest, drawing capital away from Bitcoin and reducing its share of the overall cryptocurrency market.
Bitcoin Dominance vs Altcoins
The relationship between Bitcoin dominance and altcoins reflects a recurring cycle of capital rotation. Understanding this dynamic is essential for successful trading and effective portfolio management.
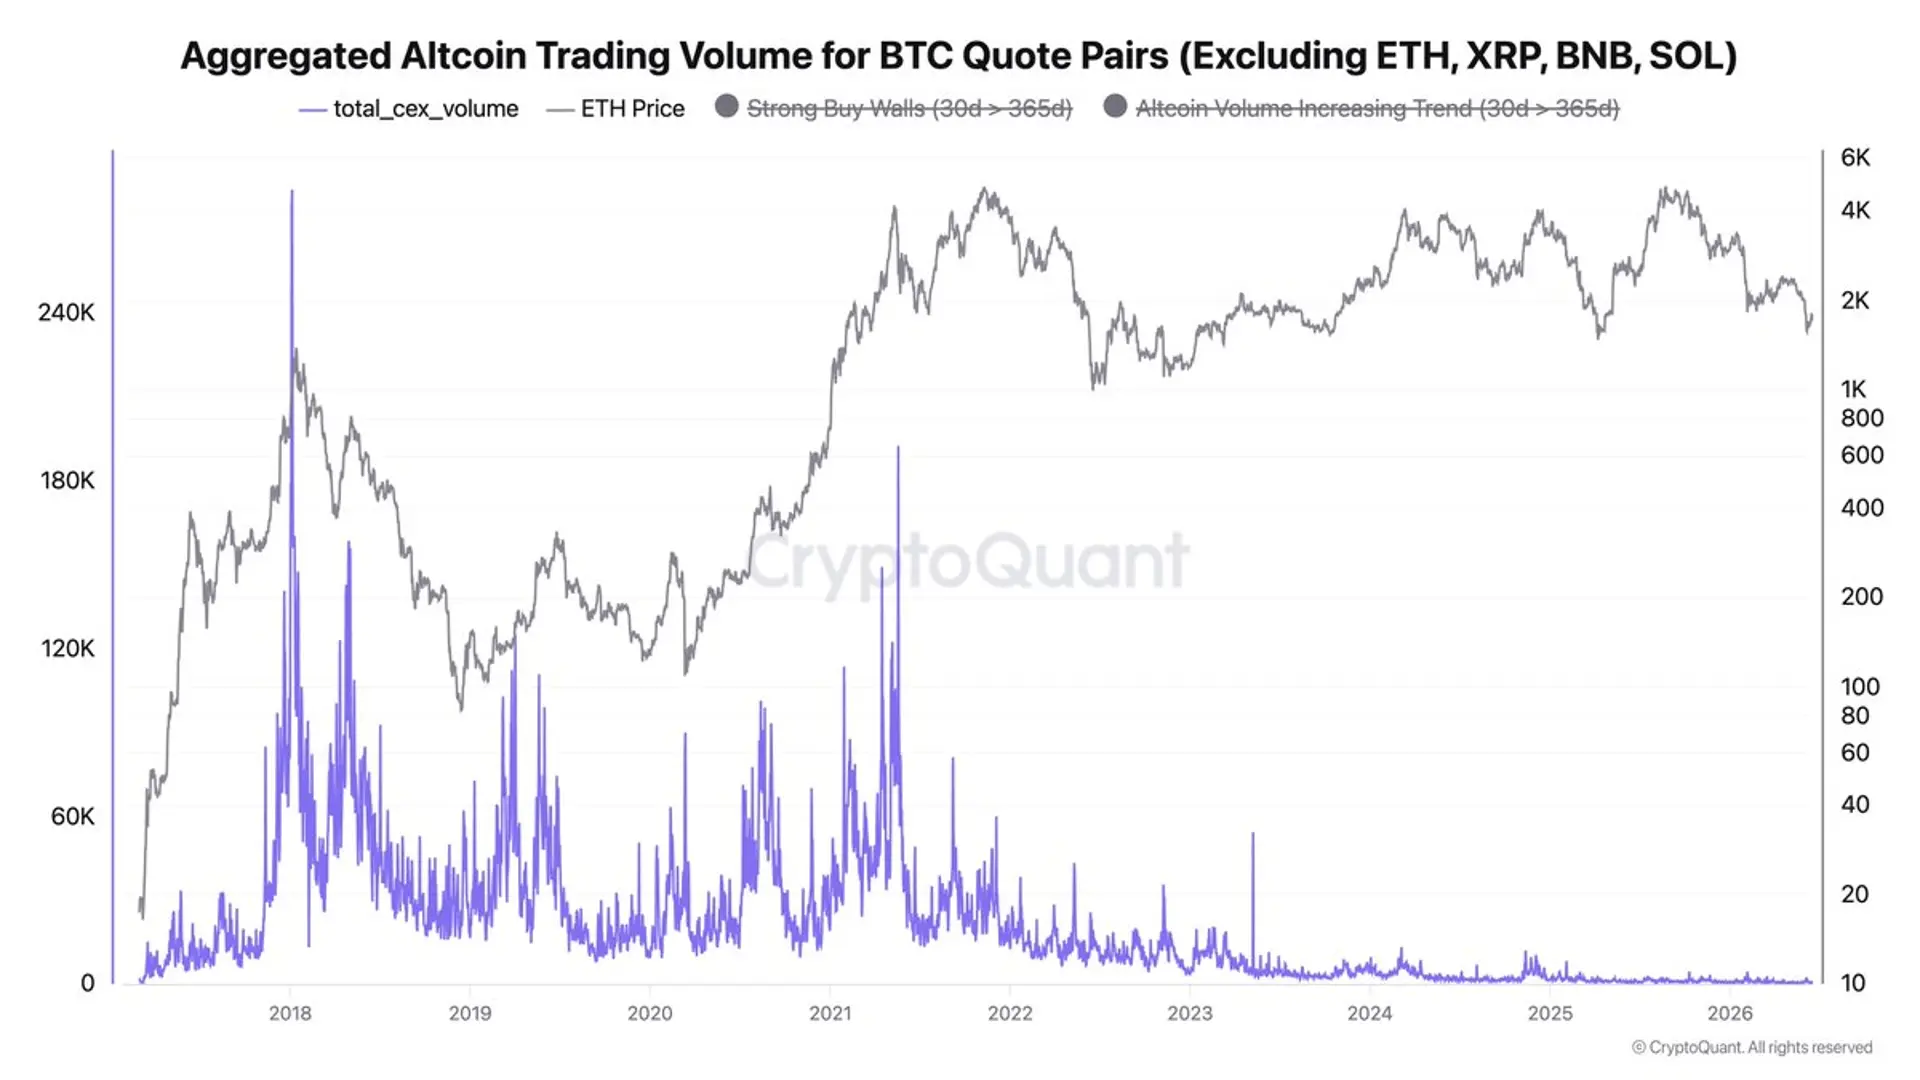
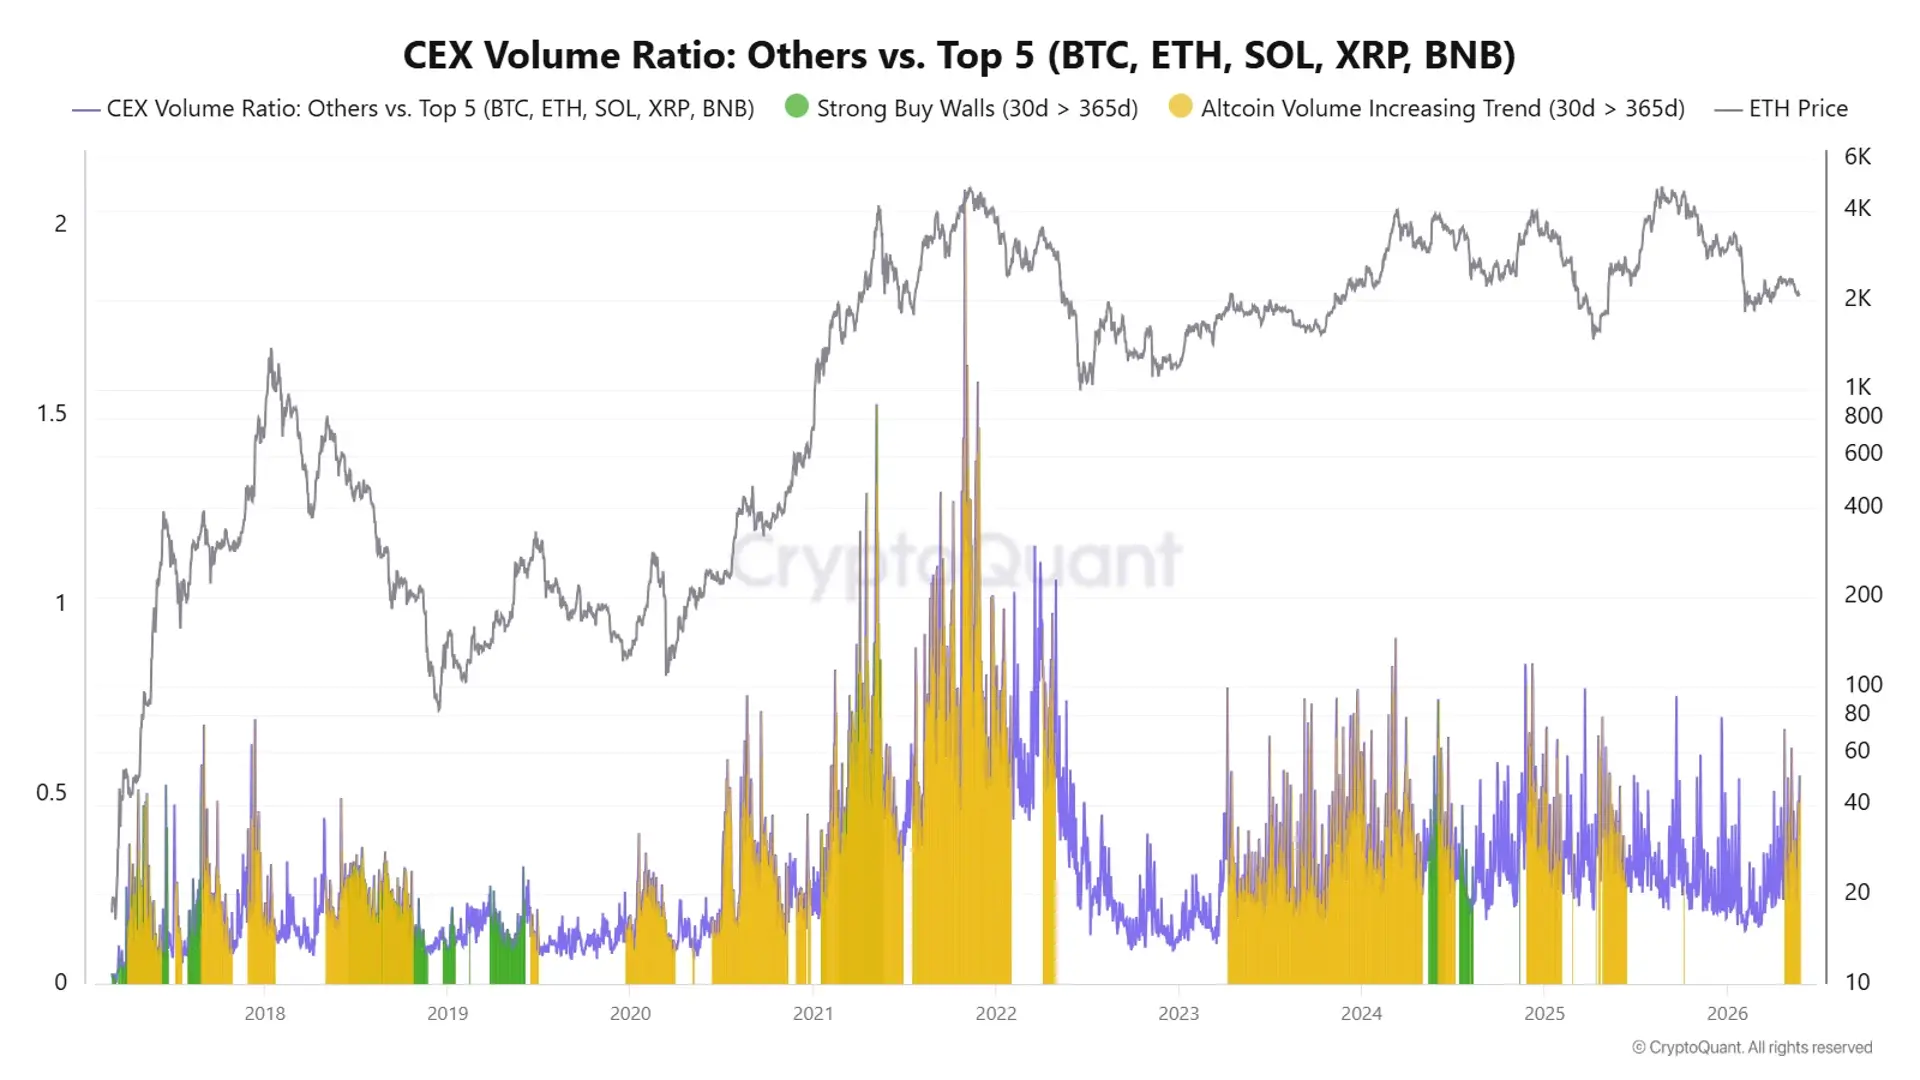
Let's take a closer look at how BTC.D affects altcoins. When Bitcoin dominance rises, altcoins generally decline or, at the very least, underperform Bitcoin. Capital flows into the safe haven, putting pressure on the altcoin sector. There are, of course, exceptions. Individual projects with strong fundamental catalysts can continue to appreciate even as Bitcoin dominance increases. However, the overall trend for the altcoin market usually remains bearish.
When Bitcoin dominance declines, altcoins tend to outperform Bitcoin. This is the beginning of the much-anticipated altseason. During these periods, even mediocre projects with weak fundamentals can post outsized gains simply because of abundant liquidity and market euphoria.
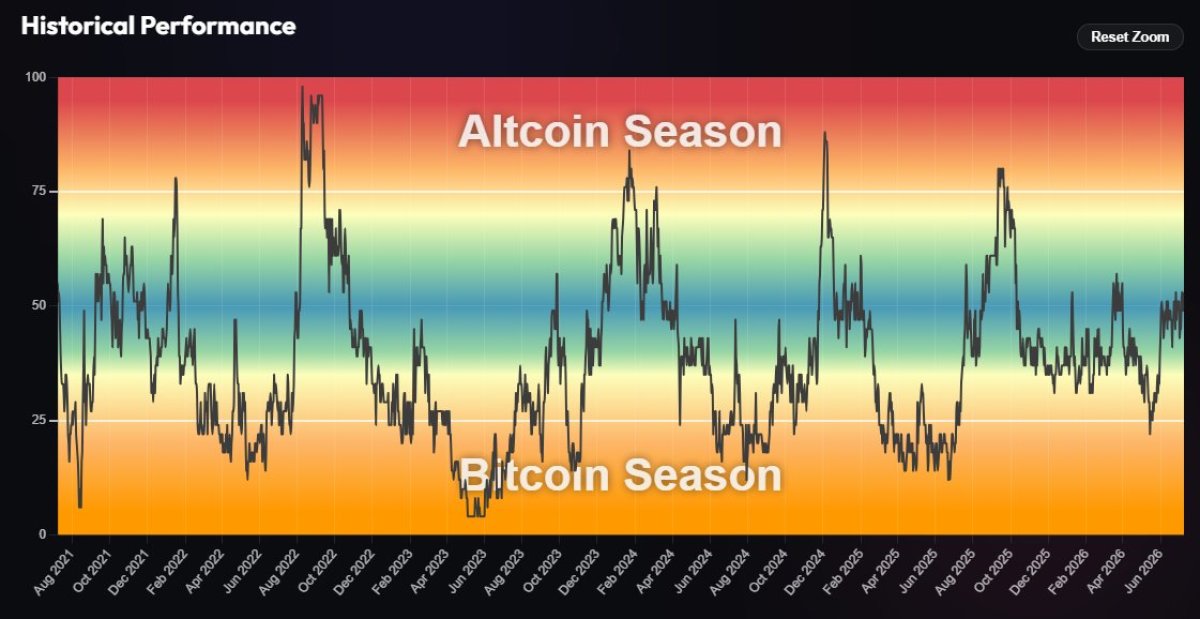
A typical Altseason Index
So, what exactly is an altseason? An altseason (Altcoin Season) is a period during which most altcoins significantly outperform Bitcoin.
Bitcoin dominance and altcoin performance are inversely correlated, making this one of the most reliable patterns in cryptocurrency trading. When BTC.D declines, altcoins typically outperform. When BTC.D rises, altcoins tend to underperform or lose value.
However, there is one important point to keep in mind: an altseason does not mean that every altcoin will rise indiscriminately. More often, it is a selective—and sometimes ruthless—process in which only the strongest projects with solid fundamentals, active development, and strong communities continue to rise. Meanwhile, weaker projects may continue to decline despite the broader altseason. For this reason, BTC.D should be viewed as an initial screening tool rather than a signal to buy every cryptocurrency other than Bitcoin.
How to Use Bitcoin Dominance in Trading
Now let’s move on to the most important question: how can Bitcoin dominance be used in real trading to improve returns while managing risk?
It is important to understand that BTC.D is best used as a powerful decision-making filter rather than a standalone trading signal. It helps traders identify the current market phase and understand where capital is flowing.
BTC.D can be incorporated into a trading strategy at several levels.
-
The first level is identifying the market phase. Bitcoin dominance reveals whether Bitcoin or altcoins are currently leading the market. If BTC.D is rising, capital is flowing into Bitcoin, suggesting a more cautious approach to altcoins. If BTC.D is falling, capital is rotating into altcoins, indicating stronger risk appetite and creating more favorable conditions for altcoin investments.
-
The second level is filtering trading opportunities. Many traders use BTC.D as an additional confirmation tool. For example, if your technical analysis generates a buy signal for an altcoin while Bitcoin dominance is rising rapidly, it may be worth re-evaluating the setup or reducing your position size. Conversely, falling dominance strengthens bullish signals for altcoins. If you trade Bitcoin itself, be sure to analyze both long and short opportunities separately: BTC.D provides valuable market context, but it does not determine entry points.
-
The third level is combining BTC.D with other indicators. Bitcoin dominance is most effective when used alongside other analytical tools, such as the Fear & Greed Index, on-chain metrics (including SOPR and MVRV), trading volume, and spot Bitcoin ETF flows. On its own, Bitcoin dominance represents only one part of the picture. A comprehensive view of the market emerges only when btc dominance is combined with macroeconomic analysis, technical analysis, and data on the behavior of major market participants.
Conclusion
Bitcoin dominance represents Bitcoin’s share of the total cryptocurrency market capitalization and reflects investor sentiment at any given moment. Rising dominance almost always indicates that capital is flowing into Bitcoin—either as a flight to safety during periods of market uncertainty or as the first stage of capital inflows at the beginning of a bull market. Conversely, a decline in Bitcoin dominance often signals the start of an altseason, as capital rotates into riskier assets.
BTC market dominance is far more than just another interesting market statistic. It is a dynamic indicator of market sentiment. It reveals where capital is flowing, what investors fear, when panic is emerging, and when conditions are becoming favorable for altcoins. However, like any technical analysis tool, BTC.D must be interpreted correctly, viewed with healthy skepticism, and used alongside other sources of market data.
The content of this article reflects the author’s opinion and does not necessarily reflect the official position of LiteFinance broker. The material published on this page is provided for informational purposes only and should not be considered as the provision of investment advice for the purposes of Directive 2014/65/EU.
According to copyright law, this article is considered intellectual property, which includes a prohibition on copying and distributing it without consent.