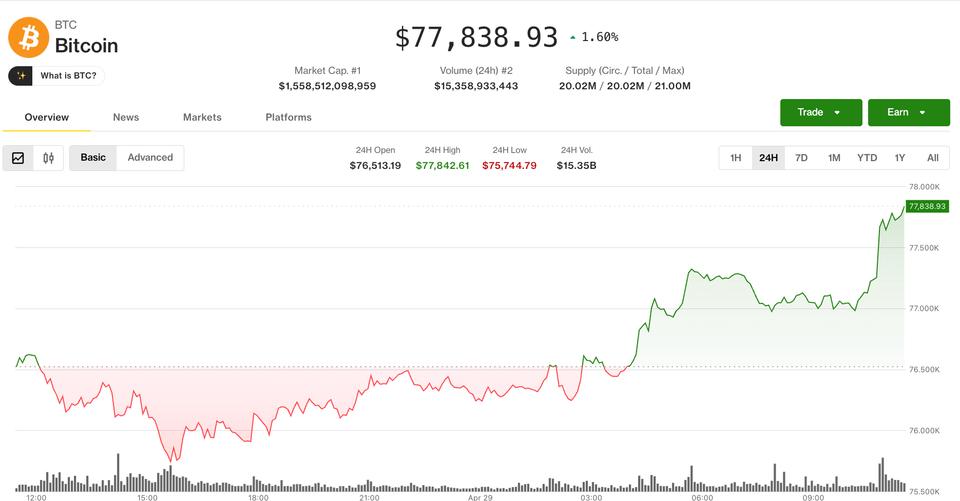
Bitcoin has fallen to a four-month low of $65,707 after losing about 7% in the past 24 hours and more than 12% over the last seven days.
According to CoinGecko data, Bitcoin briefly touched $65,707.79 on June 3 before recovering slightly above $67,000, extending a week-long decline that has left the world’s largest cryptocurrency under pressure while US equities continue to trade near record highs.
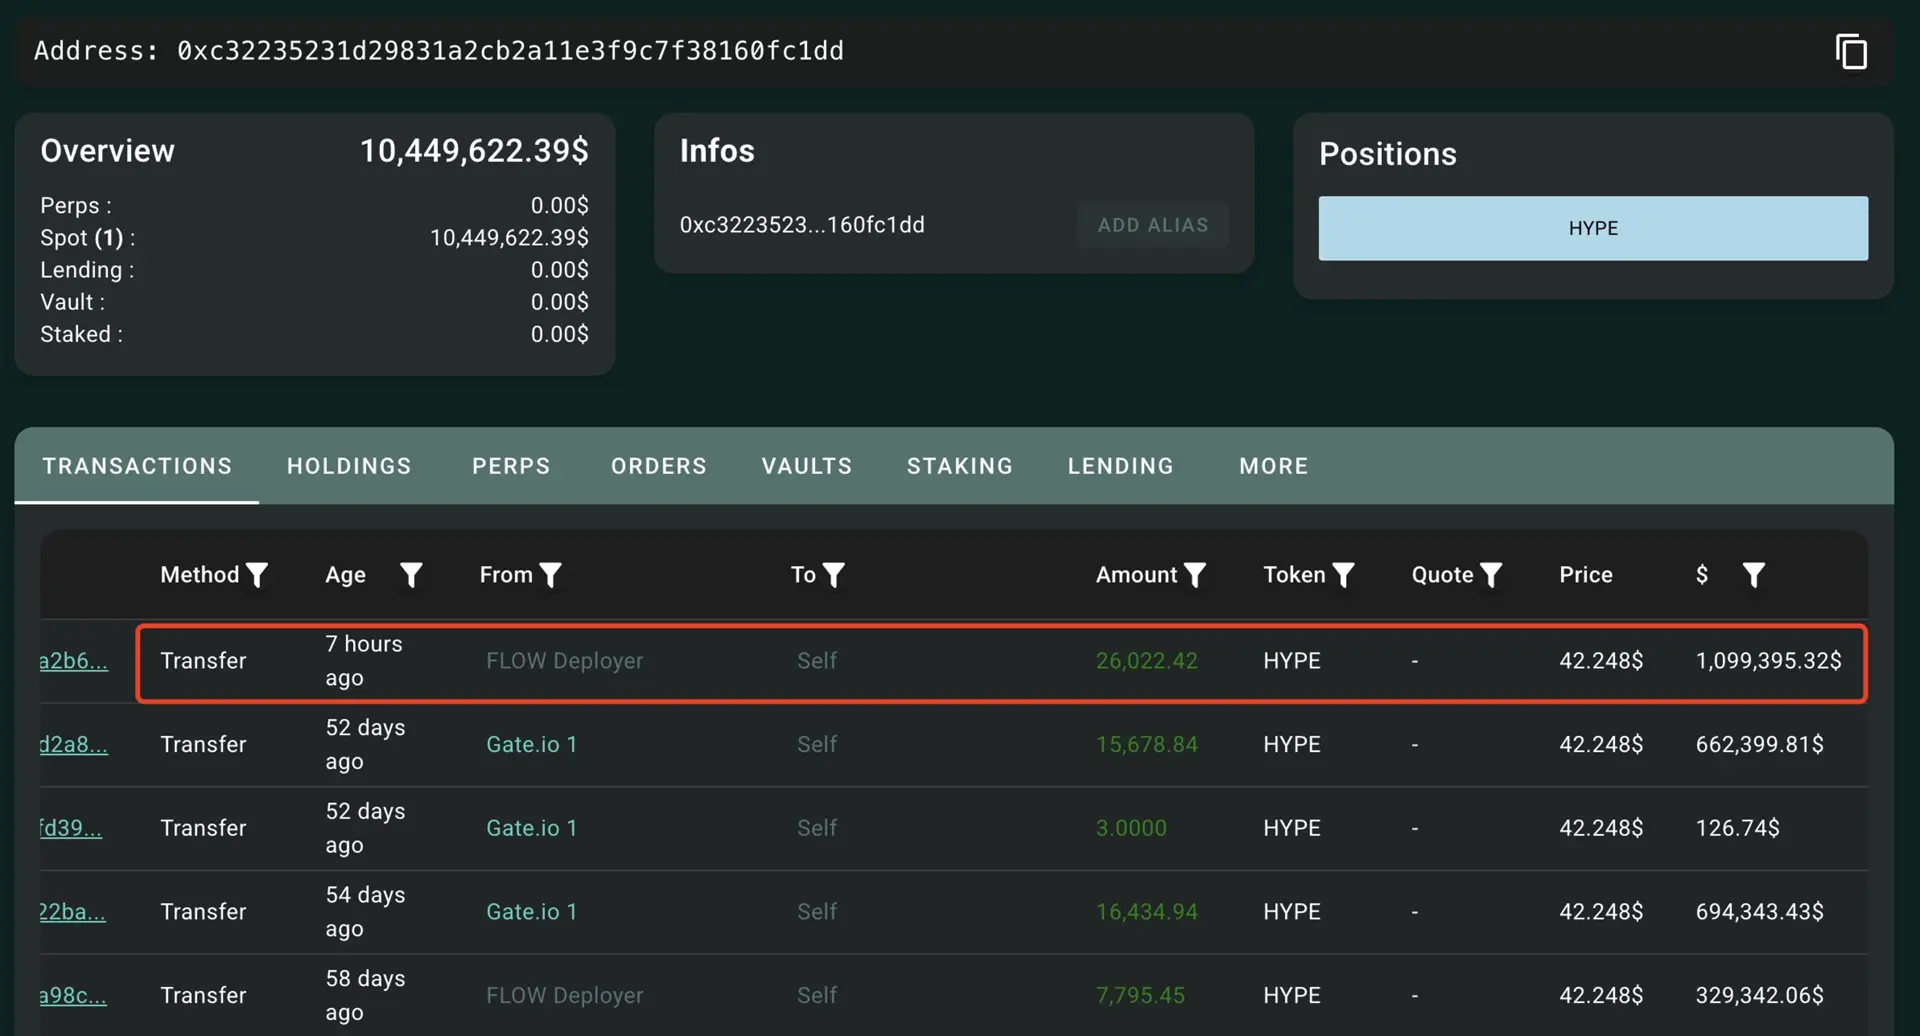
Selling accelerated after Strategy disclosed in a filing with the US Securities and Exchange Commission that it had sold 32 Bitcoin to fund preferred stock dividend payments.
Although the transaction represented only a tiny portion of the company’s holdings, it carried symbolic weight because it was the first net reduction in Strategy’s Bitcoin position in more than three years.
Market sentiment deteriorated further after on-chain data showed the Mt. Gox estate moved approximately $739 million worth of Bitcoin from its wallets.
Earlier creditor distributions linked to the collapsed exchange have often been associated with selling activity, prompting fresh concerns among traders.
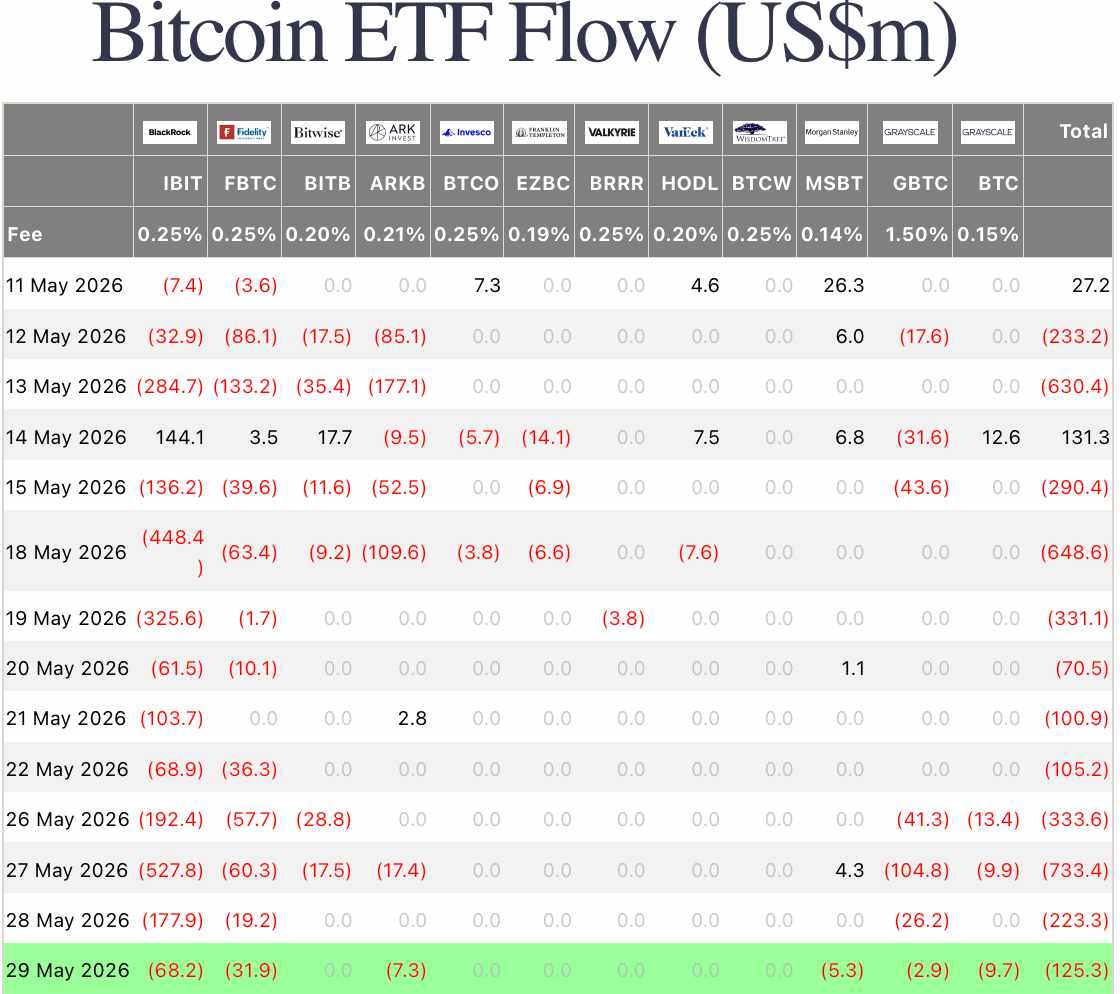
Pressure on prices has also coincided with persistent institutional outflows. K33 Research reported that spot Bitcoin exchange-traded products recorded net outflows of 62,794 BTC during the past three weeks, the second-largest outflow streak on record.
US spot Bitcoin ETFs recently completed a 12-day run of net withdrawals, the longest since their launch.

Spot Bitcoin ETF netflows since May 12. Source: SoSoValue.
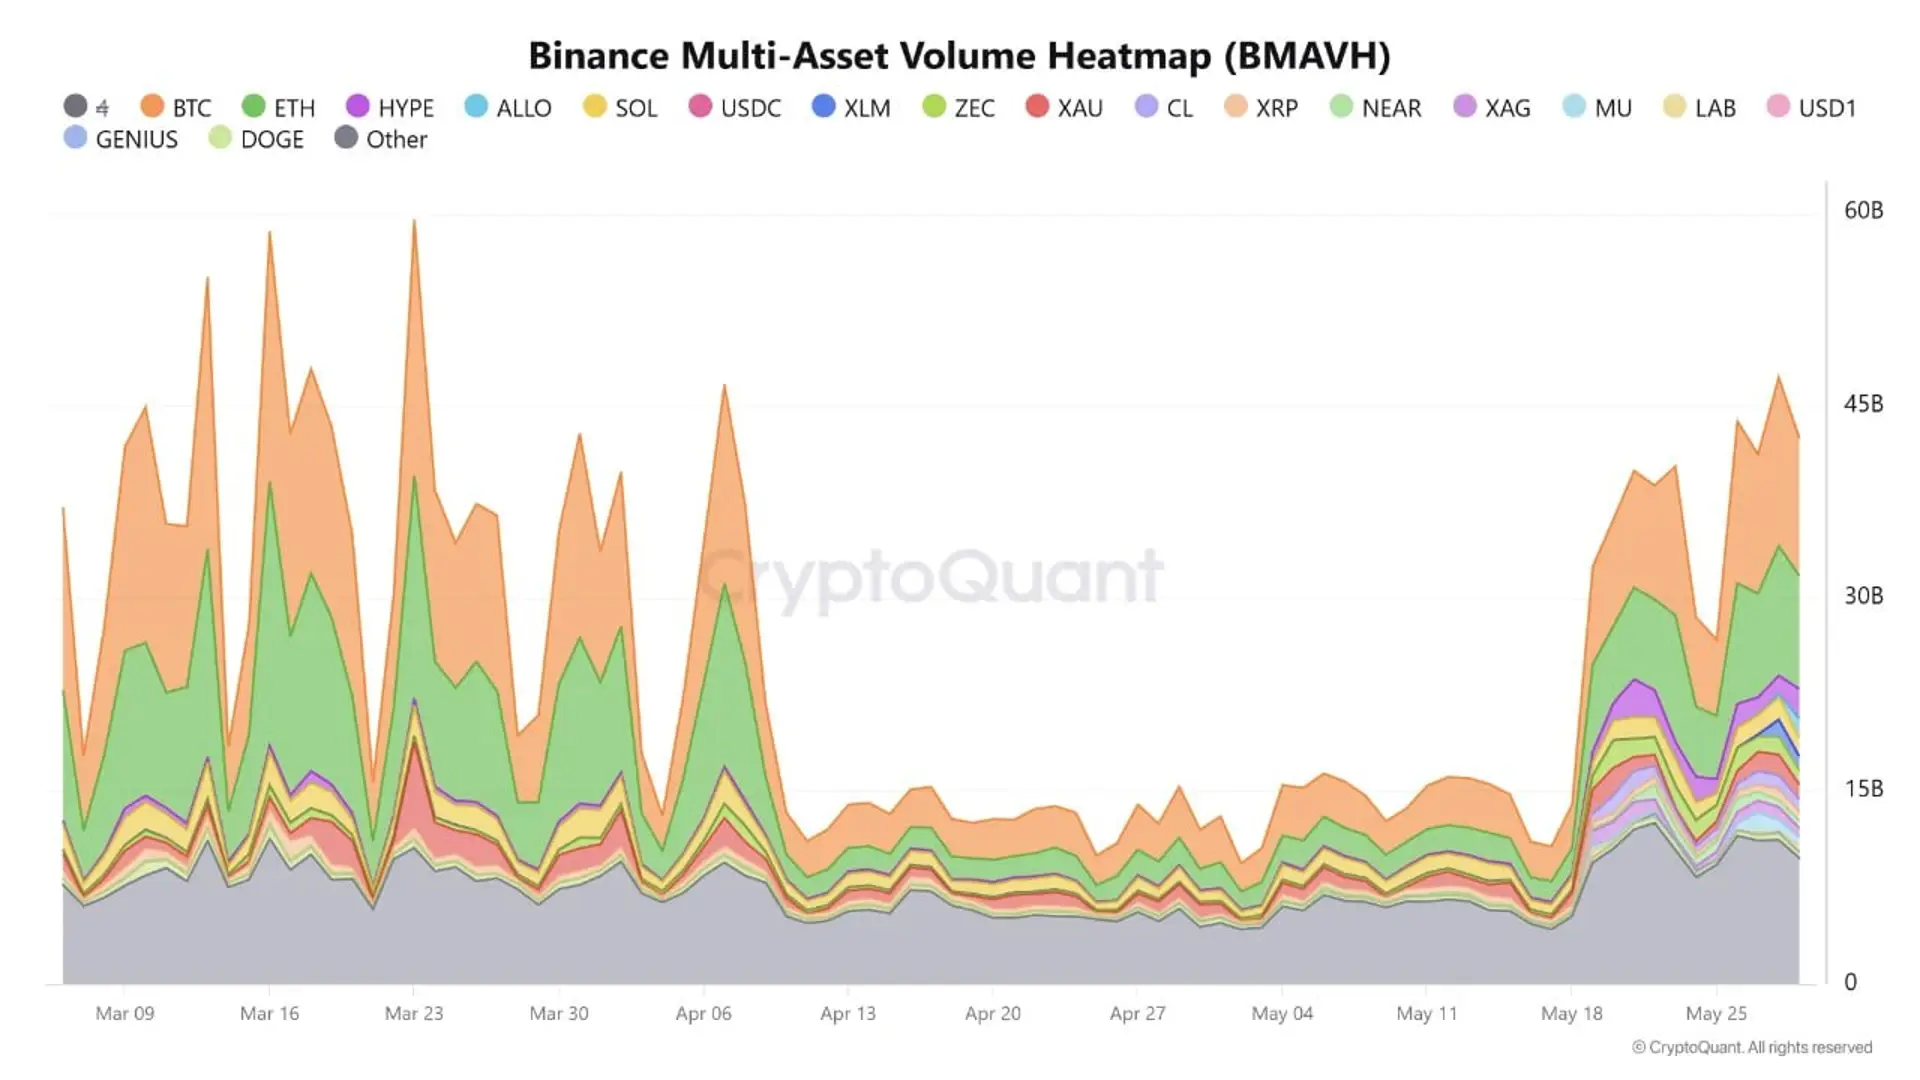
Meanwhile, Binance Research has recently warned about capital concentration in a handful of artificial intelligence-related stocks as investors increasingly direct funds toward sectors benefiting from the AI boom.
K33 Research head Vetle Lunde echoed a similar view, writing that many investors see the opportunity cost of holding Bitcoin as too high while AI-related investments continue attracting capital.
SBI Holdings chairman and president Yoshitaka Kitao also argued that institutional investors may be raising funds ahead of potential future public offerings involving companies such as SpaceX, Anthropic, and OpenAI.
“From a fundamental perspective, there are no concerns whatsoever, and I am convinced that if the Clarity Act is enacted in the United States, it will bring a positive impact to the cryptocurrency market, including Ripple,” Kitao added.
Escalating tensions between the United States and Iran have also failed to boost Bitcoin’s appeal as a defensive asset.
Instead, capital has continued flowing toward traditional safe havens such as gold and US Treasuries while cryptocurrencies have traded more like speculative risk assets.
A large derivatives wipeout amplified the decline once Bitcoin broke below key support levels.
CoinGlass data shows total crypto liquidations reached roughly $1.9 billion over the past 24 hours, with long positions accounting for about $1.7 billion of that figure. Nearly 279,500 traders were liquidated during the period.

Total crypto liquidations. Source: CoinGlass.
Bitcoin alone accounted for around $894.5 million in liquidations, making it the hardest-hit asset during the selloff.
Ethereum followed with approximately $480.5 million.
CoinGlass data also shows that the largest single liquidation order occurred on HTX in the BTC-USDT pair and was valued at about $59.7 million.
As leveraged long positions were forced to close, automated selling across derivatives exchanges added to the downward momentum already created by spot-market weakness.
The liquidation cascade pushed Bitcoin below several technical support zones and accelerated the drop toward the $65,000 area.
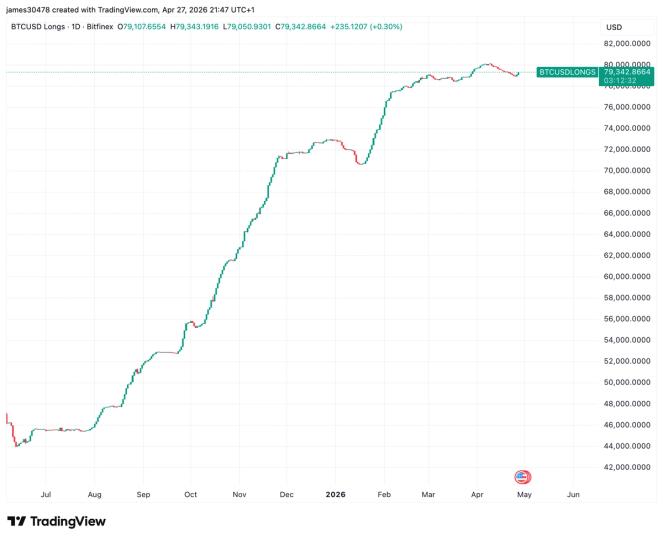
Meanwhile, the daily chart shows Bitcoin trading below its 20-day, 50-day, 100-day and 200-day exponential moving averages, a sign that sellers remain in control across multiple timeframes.

BTC/USD 1-day price chart. Source: TradingView.
Current chart data places the 20 EMA near $74,041, the 50 EMA near $75,287, the 100 EMA around $76,063, and the 200 EMA near $80,675. Reclaiming those levels would require a substantial recovery from current prices.
At the same time, Bitcoin has fallen below the lower Bollinger Band, which sits around $68,353.
Such moves often indicate that price has become stretched to the downside, though they do not guarantee an immediate reversal.
Looking at the 24-hour liquidation heatmap from CoinGlass, sizeable liquidity clusters have formed above the market between roughly $68,000 and $72,000.

Bitcoin liquidation heatmap. Source: Coinglass.
Dense pockets of leveraged positions appear around $68,300, $69,000, $70,000 and $72,000.
Because markets frequently gravitate toward areas with large concentrations of liquidity, a short-term rebound could draw Bitcoin back toward those levels.
A move above $68,000 could therefore expose several liquidation zones that may act as magnets for price.
Below the market, support remains concentrated around the recent low near $65,000, followed by pockets of liquidity closer to the $64,000 region. Failure to hold those levels could open the door towards $60,000.
Many analysts, while bearish, remain divided on how far the current decline could extend.
For instance, according to Crypto analyst Ted Pillows, Bitcoin is repeating a previous chart pattern that preceded a steep correction.
Comparing the current structure with an earlier rising-channel breakdown, he said a drop toward $50,000 remains possible if history repeats itself.
Pillows also referenced a Kalshi Crypto forecast market that showed traders assigning odds to Bitcoin falling to that level this year.

BTC/USD 1-day price chart. Source: Ted Pillows on X.
Pseudonymous analyst SuperBro has taken a less bearish stance.
In a recent analysis, he argued that the current setup resembles a break from an ascending channel rather than a classic bear flag.

BTC/USD 1-day price chart. Source: SuperBro on X.
According to SuperBro, a loss of the previous swing low near $65,000 could send Bitcoin toward $61,000.
He contends that a true bear-flag pattern would imply targets closer to $45,000 to $50,000, whereas the measured move from the current channel structure points to a higher low forming near the weekly 200 simple moving average.
For now, Bitcoin remains caught between heavy overhead liquidation zones and a support area that has already come under intense pressure.
Whether buyers can reclaim the $68,000 to $72,000 region or sellers force another breakdown below $65,000 is likely to determine the next phase of price action.